The WPJ
Residential Real Estate News


Post Trump Election Victory, U.S. Home Sales Take Off in January
Best Monthly Sales In Pace in a Decade, Says NAR
According to the National Association of Realtors (NAR), existing-home sales enjoyed a very fast start in 2017, surpassing a recent cyclical high and increasing in January 2017 to the fastest pace in almost a decade. All major regions except for the Midwest saw sales gains last month.
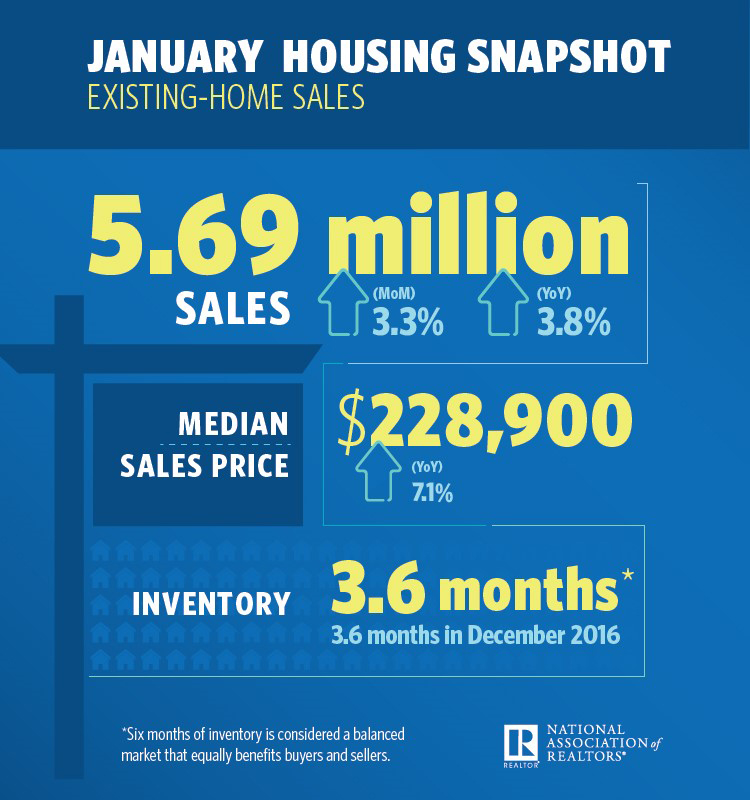
Total existing-home sales, which are completed transactions that include single-family homes, townhomes, condominiums and co-ops, expanded 3.3 percent to a seasonally adjusted annual rate of 5.69 million in January from an upwardly revised 5.51 million in December 2016. January's sales pace is 3.8 percent higher than a year ago (5.48 million) and surpasses November 2016 (5.60 million) as the strongest since February 2007 (5.79 million).
Lawrence Yun, NAR chief economist, says January's sales gain signals resilience among consumers even in a rising interest rate environment. "Much of the country saw robust sales activity last month as strong hiring and improved consumer confidence at the end of last year appear to have sparked considerable interest in buying a home," he said. "Market challenges remain, but the housing market is off to a prosperous start as homebuyers staved off inventory levels that are far from adequate and deteriorating affordability conditions."
The median existing-home price for all housing types in January was $228,900, up 7.1 percent from January 2016 ($213,700). January's price increase was the fastest since last January (8.1 percent) and marks the 59th consecutive month of year-over-year gains.
Total housing inventory at the end of January rose 2.4 percent to 1.69 million existing homes available for sale, but is still 7.1 percent lower than a year ago (1.82 million) and has fallen year-over-year for 20 straight months. Unsold inventory is at a 3.6-month supply at the current sales pace (unchanged from December 2016).
Properties typically stayed on the market for 50 days in January, down from 52 days in December and considerably more a year ago (64 days). Short sales were on the market the longest at a median of 108 days in January, while foreclosures sold in 51 days and non-distressed homes took 49 days. Thirty-eight percent of homes sold in January were on the market for less than a month.
"Competition is likely to heat up even more heading into the spring for house hunters looking for homes in the lower- and mid-market price range," added Yun. "NAR and realtor.com's new ongoing research - the Realtor Affordability Distribution Curve and Score - revealed that the combination of higher rates and prices led to households in over half of all states last month being able to afford less of all active inventory on the market based on their income."
Inventory data from realtor.com reveals that the metropolitan statistical areas where listings stayed on the market the shortest amount of time in January were San Jose-Sunnyvale-Santa Clara, Calif., 43 days; San Francisco-Oakland-Hayward, Calif., 47 days; San Diego-Carlsbad, Calif., 55 days; Seattle-Tacoma-Bellevue, Wash., 57 days; and Nashville-Davidson-Murfreesboro-Franklin, Tenn., Vallejo-Fairfield, Calif., and Greeley, Colo., all at 58 days.
NAR President William E. Brown cautions about another source that could possibly drag down inventory for would-be buyers in coming months. "Supply and demand imbalances continue to be burdensome in many markets, and now Fannie Mae is supporting a Wall Street firm's investment in single-family rentals," he said. "This will only further hamper tight supply and put major investors in direct competition with traditional buyers. Instead, the GSEs should lower overly burdensome fees and help qualified borrowers become homeowners."
First-time buyers were 33 percent of sales in January, which is up from 32 percent both in December and a year ago. NAR's 2016 Profile of Home Buyers and Sellers - released in late 2016 - revealed that the annual share of first-time buyers was 35 percent.
According to Freddie Mac, the average commitment rate for a 30-year, conventional, fixed-rate mortgage decreased slightly in January to 4.15 percent from 4.20 percent in December. The average commitment rate for all of 2016 was 3.65 percent.
All-cash sales were 23 percent of transactions in January, up from 21 percent in December but down from 26 percent a year ago. Individual investors, who account for many cash sales, purchased 15 percent of homes in January, unchanged from December and down from 17 percent a year ago. Fifty-nine percent of investors paid in cash in January.
Distressed sales - foreclosures and short sales - were 7 percent of sales in January, unchanged from December and down from 9 percent a year ago. Five percent of January sales were foreclosures and 2 percent were short sales. Foreclosures sold for an average discount of 14 percent below market value in January (20 percent in December), while short sales were discounted 10 percent (unchanged from December).
Single-family and Condo/Co-op Sales
Single-family home sales grew 2.6 percent to a seasonally adjusted annual rate of 5.04 million in January from 4.91 million in December 2016, and are now 3.7 percent above the 4.86 million pace a year ago. The median existing single-family home price was $230,400 in January, up 7.3 percent from January 2016.
Existing condominium and co-op sales leapt 8.3 percent to a seasonally adjusted annual rate of 650,000 units in January, and are now 4.8 percent higher than a year ago. The median existing condo price was $217,400 in January, which is 6.2 percent above a year ago.
January existing-home sales in the Northeast jumped 5.3 percent to an annual rate of 800,000, and are now 6.7 percent above a year ago. The median price in the Northeast was $253,800, which is 2.5 percent above January 2016.
In the Midwest, existing-home sales decreased 1.5 percent to an annual rate of 1.29 million in January, and are 0.8 percent below a year ago. The median price in the Midwest was $174,900, up 6.5 percent from a year ago.
Existing-home sales in the South in January rose 3.6 percent to an annual rate of 2.31 million, and are now 3.1 percent above January 2016. The median price in the South was $201,400, up 9.2 percent from a year ago.
Existing-home sales in the West ascended 6.6 percent to an annual rate of 1.29 million in January, and are now 8.4 percent above a year ago. The median price in the West was $332,300, up 6.8 percent from January 2016.
Real Estate Listings Showcase


This website uses cookies to improve user experience. By using our website you consent in accordance with our Cookie Policy. Read More