The WPJ
Residential Real Estate News


U.S. Home Prices Decline 4.4% Year-Over-Year in August
Based on CoreLogic's August Home Price Index (HPI), U.S. home prices decreased 0.4 percent on a month-over-month basis, the first monthly decline in four months.
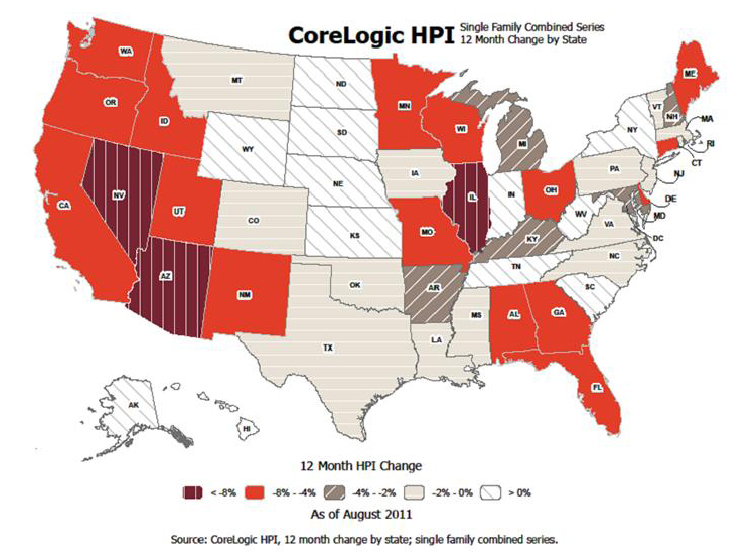
CoreLogic HPI also reports that national home prices, including distressed sales, also declined on a year-over-year basis by 4.4 percent in August 2011 compared to August 2010.
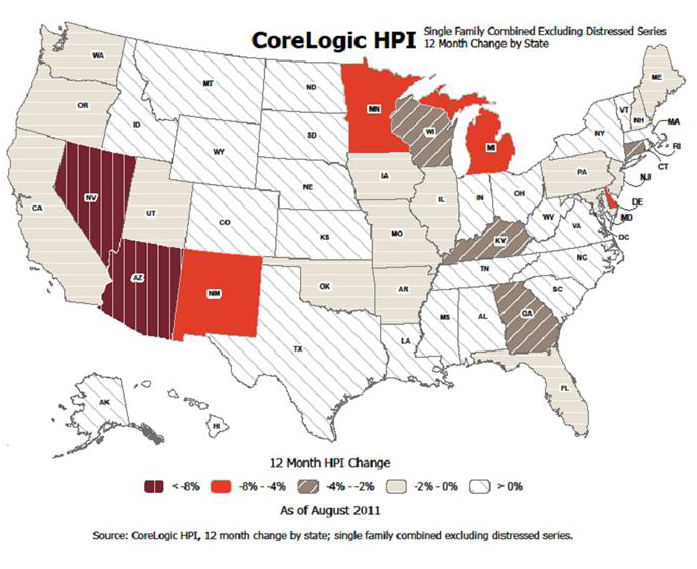
This follows a decline of 4.8 percent in July 2011 compared to July 2010. Excluding distressed sales, year-over-year prices declined by 0.7 percent in August 2011 compared to August 2010 and by 1.7* percent in July 2011 compared to July 2010. Distressed sales include short sales and real estate owned (REO) transactions.
CoreLogic's chief economist said Mark Fleming tells the World Property Channel, "Although the calendar says August, the end of the summer traditionally marks the beginning of 'fall' for the housing market as it begins to prepare for 'winter.' So the slight month-over-month decline was predictable, particularly given the renewed concerns over a double-dip recession, high negative equity, and the persistent levels of shadow inventory. The continued bright spot is the non-distressed segment of the market, which is only marginally lower than a year ago and continues to exhibit relative strength."
National Highlights as of August 2011
- Including distressed sales, the five states with the highest appreciation were: West Virginia (+8.6 percent), Wyoming (+3.6 percent), North Dakota (+3.5 percent), New York (+3.2 percent), and Alaska (+2.2 percent).
- Including distressed sales, the five states with the greatest depreciation were: Nevada (-12.4 percent), Arizona (-10.7 percent), Illinois (-9.6 percent), Minnesota (-7.8 percent), and Georgia (-7.2 percent).
- Excluding distressed sales, the five states with the highest appreciation were: West Virginia (+10.7 percent), Mississippi (+4.8 percent), Hawaii (+4.4 percent), North Dakota (+4.2 percent), and Kansas (+3.7 percent).
- Excluding distressed sales, the five states with the greatest depreciation were: Nevada (-8.8 percent), Arizona (-8.3 percent), Delaware (-4.9 percent), Michigan (-4.3 percent), and Minnesota (-4.2 percent).
- Including distressed transactions, the peak-to-current change in the national HPI (from April 2006 to August 2011) was-30.5 percent. Excluding distressed transactions, the peak-to-current change in the HPI for the same period was -21.0 percent.
- Of the top 100 Core Based Statistical Areas (CBSAs) measured by population, 80 are showing year-over-year declines in August, eight fewer than in July.
Real Estate Listings Showcase


This website uses cookies to improve user experience. By using our website you consent in accordance with our Cookie Policy. Read More