The WPJ
Residential Real Estate News


After Losing $6.6 Trillion in Value Since 2007 Sales Peak, U.S. Home Prices Are Back to Mid-2003 Levels
Based on the latest S&P/Case-Shiller Home Price Index, U.S. home prices showed increases of +0.2% for the 10- and 20-City Composites in August versus July.
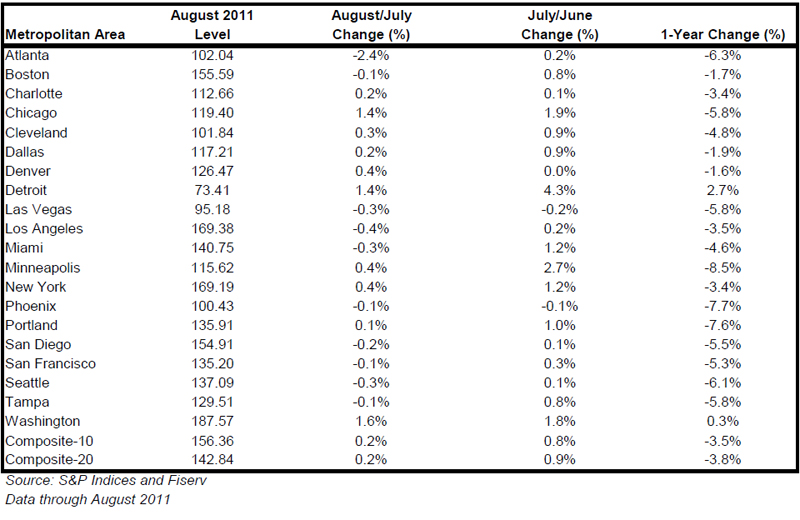
Ten of the 20 cities covered by the indices also saw home prices increase over the month. In addition, 16 of the 20 MSAs and both composites posted improved annual returns compared to July's data; Los Angeles and Miami saw no change in annual returns in August; and Atlanta and Las Vegas saw their annual rates of change fall deeper into negative territory. The 10- and 20-City Composites posted annual returns of -3.5% and -3.8% versus August 2010, respectively. At -8.5%, Minneapolis posted the lowest year-over-year return, but has improved in each of the last three months. Detroit and Washington DC were the only two cities to post positive annual returns of +2.7% and +0.3% respectively.
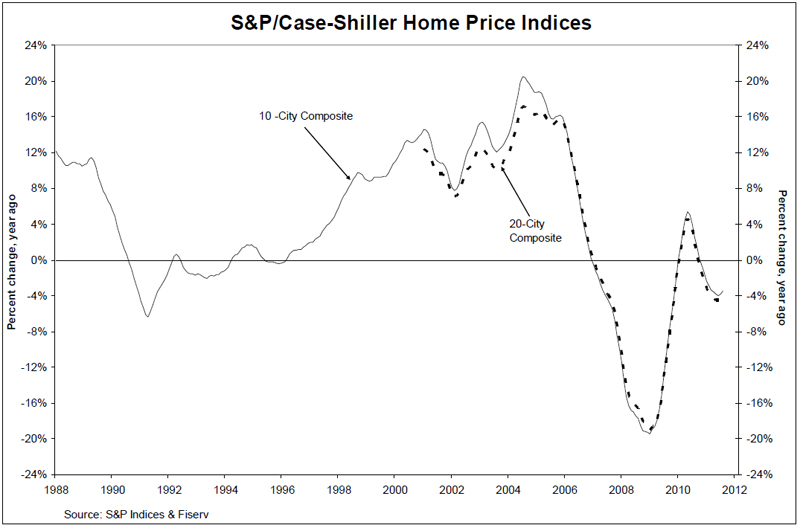
The chart above depicts the annual returns of the 10-City and the 20-City Composite Home Price Indices. In August 2011, the 10- and 20-City Composites recorded annual returns of -3.5% and -3.8%, respectively. Both Composites and 16 MSAs - Boston, Charlotte, Chicago, Cleveland, Dallas, Denver, Detroit, Minneapolis, New York, Phoenix, Portland, San Diego, San Francisco, Seattle, Tampa, and Washington DC - saw their annual rates improve in August compared to July.
"There was some weakness in the monthly statistics, as 10 of the cities post price declines in August over July," says David M. Blitzer, Chairman of the Index Committee at S&P Indices. "And even though the annual rates are largely improving, 18 MSAs and both Composites are still negative. Nationally, home prices are still below where they were a year ago. The 10-City Composite is down 3.5% and the 20-City is down 3.8% compared to August 2010.
"In the August data, the good news is continued improvement in the annual rates of change in home prices. In spring and summer's seasonally strong period for housing demand, we cautioned that monthly increases in prices had to be paired with improvement in annual rates before anyone could declare that the market might be stabilizing. With 16 of 20 cities and both Composites seeing their annual rates of change improve in August, we see a modest glimmer of hope with these data. As of August 2011, the crisis low for the 10-City Composite was back in April 2009; whereas it was a more recent March 2011 for the 20-City Composite. Both are about 3.9% above their relative lows.
"The Midwest is one region that really stands out in terms of recent relative strength. Chicago, Detroit and Minneapolis have all posted very sharp monthly increases going back to May. These markets were some of the weakest during the crisis, particularly Detroit. But as of August 2011, Detroit is the healthiest when viewed on an annual basis. It is up 2.7% versus August 2010. Prices there are still back to their 1995 levels, but the recent pickup in the US auto industry may finally be helping.
"As seen in our past few monthly reports, there were large revisions across some of the MSAs. In particular, Washington DC was the most affected in August. Additional sale pairs data for May - July 2011 in the Washington DC MSA were received this month and resulted in the revisions."
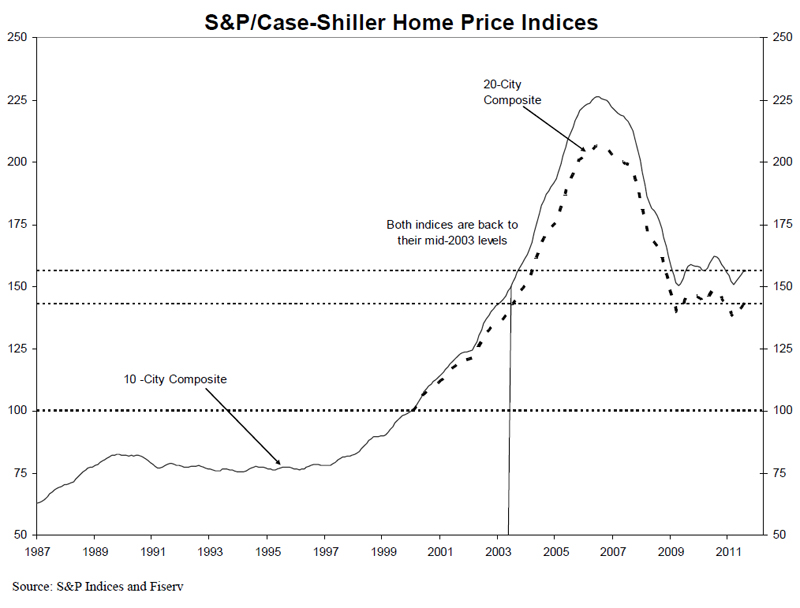
The chart on the previous page shows the index levels for the 10-City and 20-City Composite Indices. As of August 2011, average home prices across the United States are back to the levels where they were in mid-2003. Measured from their June/July 2006 peaks through August 2011, the peak-to-current declines for the 10-City Composite and 20-City Composite are -30.9% and -30.8%, respectively. The recovery from recent lows are +3.9% and +3.8%, respectively. The 10-City Composite hit its crisis low in April 2009, whereas the 20-City reached a more recent low in March 2011.
Only 10 of the 20 MSAs and both Composites posted positive monthly changes. The 10-City and 20-City Composites were up 0.2% from their July 2011 levels. Las Vegas was, again, the one city that posted a new index level low in August 2011 and is 59.5% below its August 2006 peak. Detroit and Washington DC were the only cities with positive annual returns, up 2.7% and 0.3%, respectively.
The table below summarizes the results for August 2011. The S&P/Case-Shiller Home Price Indices are revised for the 24 prior months.
Real Estate Listings Showcase


This website uses cookies to improve user experience. By using our website you consent in accordance with our Cookie Policy. Read More