The WPJ
Residential Real Estate News


U.S. Home Price Index Reports Second Consecutive Monthly Decline in September
According to CoreLogic's September Home Price Index (HPI), home prices in the U.S. decreased 1.1 percent on a month-over-month basis, the second consecutive monthly decline.
The HPI also showed that national home prices, including distressed sales, also declined by 4.1 percent in September 2011 compared to September 2010. This follows a decline of 4.4 percent in August 2011 compared to August 2010. Excluding distressed sales, year-over-year prices declined by 1.1 percent in September 2011 compared to September 2010 and by 2.2* percent in August 2011 compared to August 2010. Distressed sales include short sales and real estate owned (REO) transactions.
"Even with low interest rates, demand for houses remains muted. Home sales are down in September and the inventory of homes for sale remains elevated. Home prices are adjusting to correct for the supply-demand imbalance and we expect declines to continue through the winter. Distressed sales remain a significant share of homes that do sell and are driving home prices overall," said Mark Fleming, chief economist for CoreLogic.
National Highlights as of September 2011
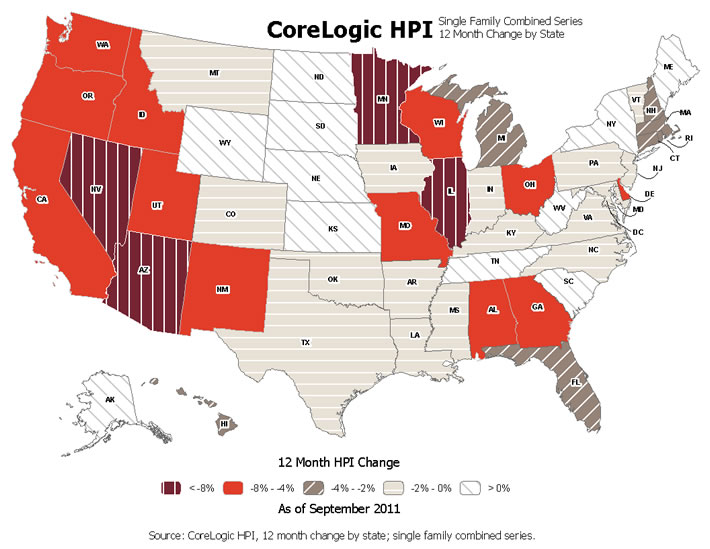
- Including distressed sales, the five states with the highest appreciation were: West Virginia (+7.0 percent), Wyoming (+3.8 percent), South Dakota (+3.6 percent), Maine (+3.5 percent), and North Dakota (+3.1 percent).
- Including distressed sales, the five states with the greatest depreciation were: Nevada (-12.4 percent), Illinois (-9.2 percent), Arizona (-9.0 percent), Minnesota (-8.3 percent), and Georgia (-7.2 percent).
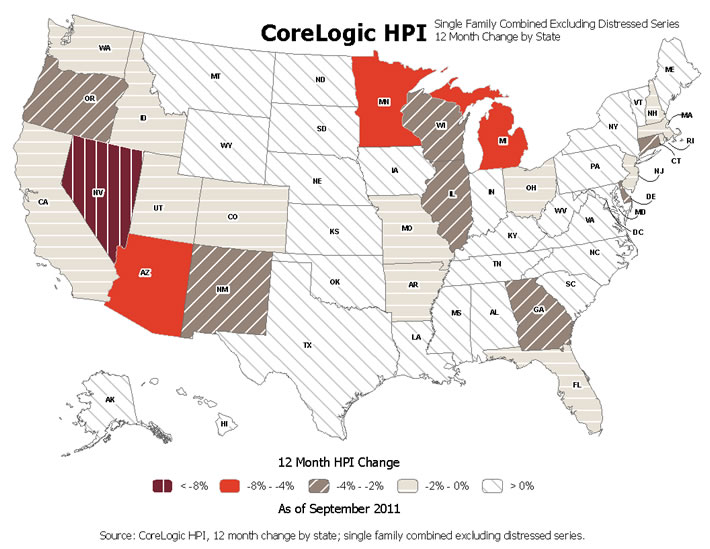
- Excluding distressed sales, the five states with the highest appreciation were: West Virginia (+13.2 percent), Maine (+5.8 percent), Wyoming (+4.8 percent), Montana (+4.4 percent), and Kansas (+3.9 percent).
- Excluding distressed sales, the five states with the greatest depreciation were: Nevada (-9.6 percent), Arizona (-7.7 percent), Minnesota (-5.9 percent), Michigan (-4.8 percent), and Delaware (-3.7 percent).
- Including distressed transactions, the peak-to-current change in the national HPI (from April 2006 to September 2011) was -31.2 percent. Excluding distressed transactions, the peak-to-current change in the HPI for the same period was -21.9 percent.
- Of the top 100 Core Based Statistical Areas (CBSAs) measured by population, 82 are showing year-over-year declines in September, the same as in August.
Real Estate Listings Showcase


This website uses cookies to improve user experience. By using our website you consent in accordance with our Cookie Policy. Read More