The WPJ
Residential Real Estate News


Metro Washington DC Housing Market Ends August as Most Active in Four Years
Based on the August 2011 RBI Pending Home Sales Index released today by Jonathan Miller of Miller Samuel, the summer home sales season in the Washington, D.C. metro area market finished with the highest number of signed contracts for August in four years.
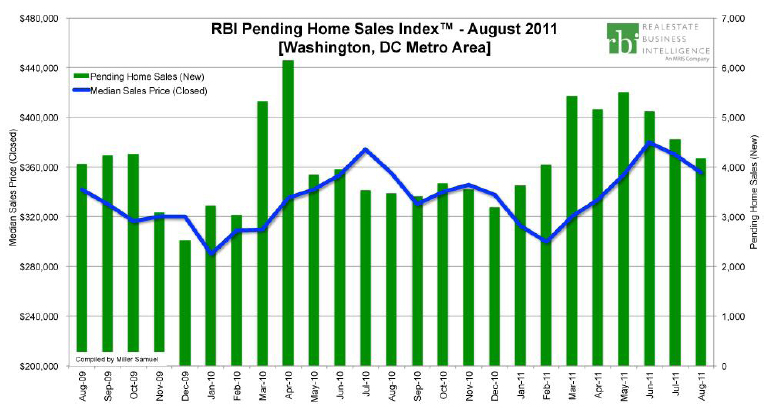
There were 4,169 contracts signed in August 2011, 8.6% less than the 4,563 contracts signed in July, but consistent with seasonal trends. New pending sales were 19.9% above the August 2010 level but that increase is exaggerated due to the dearth of activity in the months following the expiration of the federal homebuyer tax credit in April 2010. The median sales price for August 2011 showed a similar seasonal pattern, declining 3.8% to $356,000 from $370,000 in July 2011 but was essentially unchanged from August 2011.
Key Report Highlights Include:
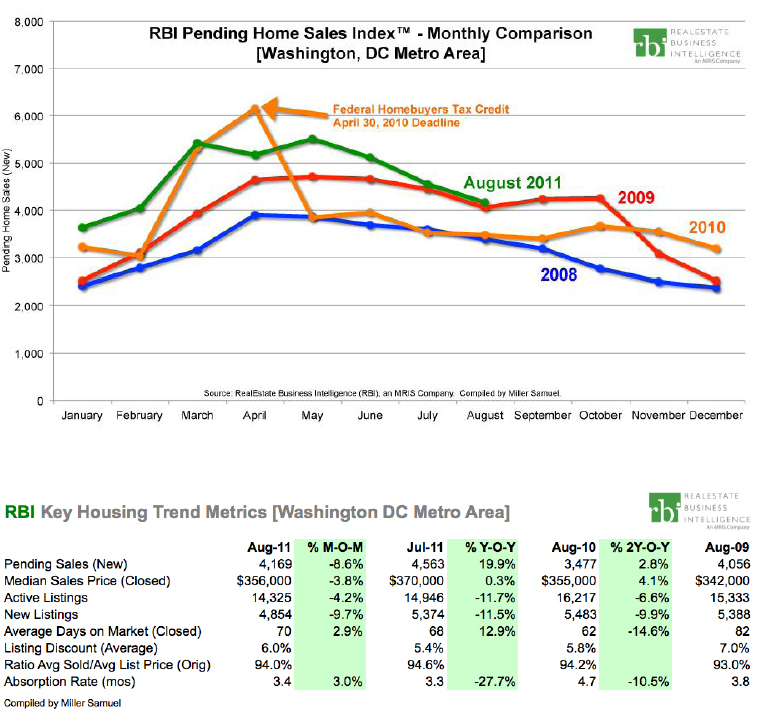
- August contracts reflected long term seasonal trends. There were 4,169 contracts signed in August 2011, 8.6% less than the 4,563 contracts signed in July, consistent with the 5-year 9% average month-over-month decline and the ten year 7.5% average month-over-month decline. The monthly total was the highest number of August signed contracts in 4 years. New pending sales were 19.9% above the August 2010 level but that increase is exaggerated due to the dearth of activity in the months following the expiration of the federal homebuyer tax credit in April 2010.
- Median sales price slipped from prior month, consistent with seasonal patterns. The median sales price for August 2011 was consistent with seasonal long-term trends, declining 3.8% to $356,000 from $370,000 in July 2011 but was essentially unchanged from August 2011. Median sales price has averaged a 3.6% month-over-month decline over 5 years and a 2.2% month-over-month decline over ten years.
- Active inventory remained just above ten year average. There were 14,325 active listings at the end of August 2011, 4.8% above the 13,667 monthly average of the past decade. However, consumers were faced with lower inventory to choose from than the same period a year ago. Active listings fell 11.7% below last year's levels and fell 4.2% from the July 2011 total of 14,946. There were 9.7% fewer listings added to the market in August 2011 than in July 2011.
- The seasonal decline in demand was matched by the decline in supply. The absorption rate was 3.4 months in August 2011, essentially unchanged from 3.3 months in July 2011 but was faster than the 4.7 month absorption rate in August 2010. The number of months to sell all active inventory at the current pace of new contract signings is a measure of market efficiency.
- Time to market a property faster than 5-year average. The average days on market was 70 in August 2011, edging up from 68 days in July 2011 and 62 days from August 2010. However, the 2.9% month-over-month increase was roughly one third the 9.2% average July to August increase over the past decade. The average discount from original list price was 6% in August 2011, edging higher than 5.8% in the same month last year but below the 7% average in August 2009.
Real Estate Listings Showcase


This website uses cookies to improve user experience. By using our website you consent in accordance with our Cookie Policy. Read More