The WPJ
Residential Real Estate News

U.S. Home Prices Dip Nationally 4.7% in 2011, Says CoreLogic Report
 Based on CoreLogic's December Home Price Index (HPI) report, home prices in the U.S. decreased 4.7 percent in 2011 compared with December 2010.
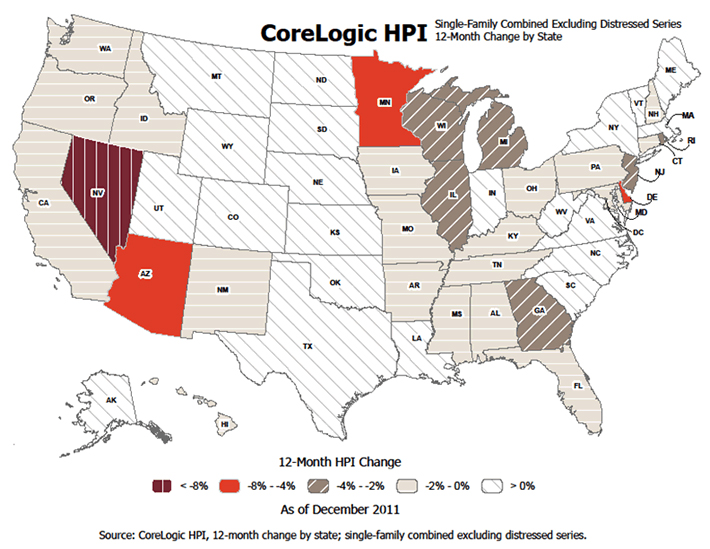
This year-end report shows that home prices continued the trend of year-end decreases--this is the fifth consecutive year with a decrease in the HPI. The HPI excluding distressed sales showed that home prices decreased by 0.9 percent in 2011, giving an indication of the impact of distressed sales on home prices in 2011.
The report also shows that national home prices including distressed sales decreased 1.4 percent on a month-over-month basis, the fifth consecutive monthly decline. However, the HPI excluding distressed sales posted its first month-over-month gain since July 2011, rising 0.2 percent. The December drop in home prices follows a decline of 4.3 percent in November 2011 compared to November 2010. Excluding distressed sales, year-over-year prices declined by 2.0 percent in November 2011 compared to November 2010. Distressed sales include short sales and real estate owned (REO) transactions.
"While overall prices declined by almost 5 percent in 2011, non-distressed prices showed only a small decrease. Until distressed sales in the market recede, we will see continued downward pressure on prices," said Mark Fleming, chief economist for CoreLogic.
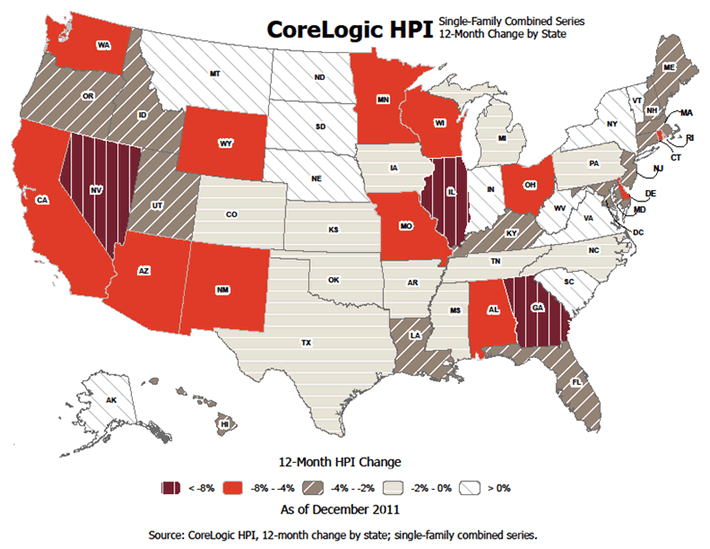
CoreLogic's HPI index includes distressed sales in the mix.
Market Highlights as of December 2011
- Including distressed sales, the five states with the highest appreciation were: Montana (+4.4 percent), Vermont (+4.0 percent), South Dakota (+3.1 percent), Nebraska (+2.5 percent) and New York (+1.7 percent).
- Including distressed sales, the five states with the greatest depreciation were: Illinois (-11.3 percent), Nevada (-10.6 percent), Georgia (-8.3 percent), Ohio (-7.7 percent), and Minnesota (-7.5 percent).
- Excluding distressed sales, the five states with the highest appreciation were: Montana (+7.7 percent), South Dakota (+3.5 percent), Indiana (+3.3 percent), Alaska (+3.1 percent), and Massachusetts (+2.9 percent).
- Excluding distressed sales, the five states with the greatest depreciation were: Nevada (-9.7 percent), Minnesota (-5.2 percent), Arizona (-4.9 percent), Delaware (-4.2 percent) and Michigan (-3.5 percent).
- Including distressed transactions, the peak-to-current change in the national HPI (from April 2006 to December 2011) was -33.7 percent. Excluding distressed transactions, the peak-to-current change in the HPI for the same period was -24.0 percent.
- The five states with the largest peak-to-current declines including distressed transactions are Nevada (-60.0 percent), Arizona (-51.9 percent), Florida (-50 percent), Michigan (-43.7 percent), and California (-43.5 percent).
- Of the top 100 Core Based Statistical Areas (CBSAs) measured by population, 81 are showing year-over-year declines in December, one more than in November.
Real Estate Listings Showcase


This website uses cookies to improve user experience. By using our website you consent in accordance with our Cookie Policy. Read More