Residential Real Estate News

Typical Monthly Mortgage Payment Up $337 in Last 6 Weeks in U.S.
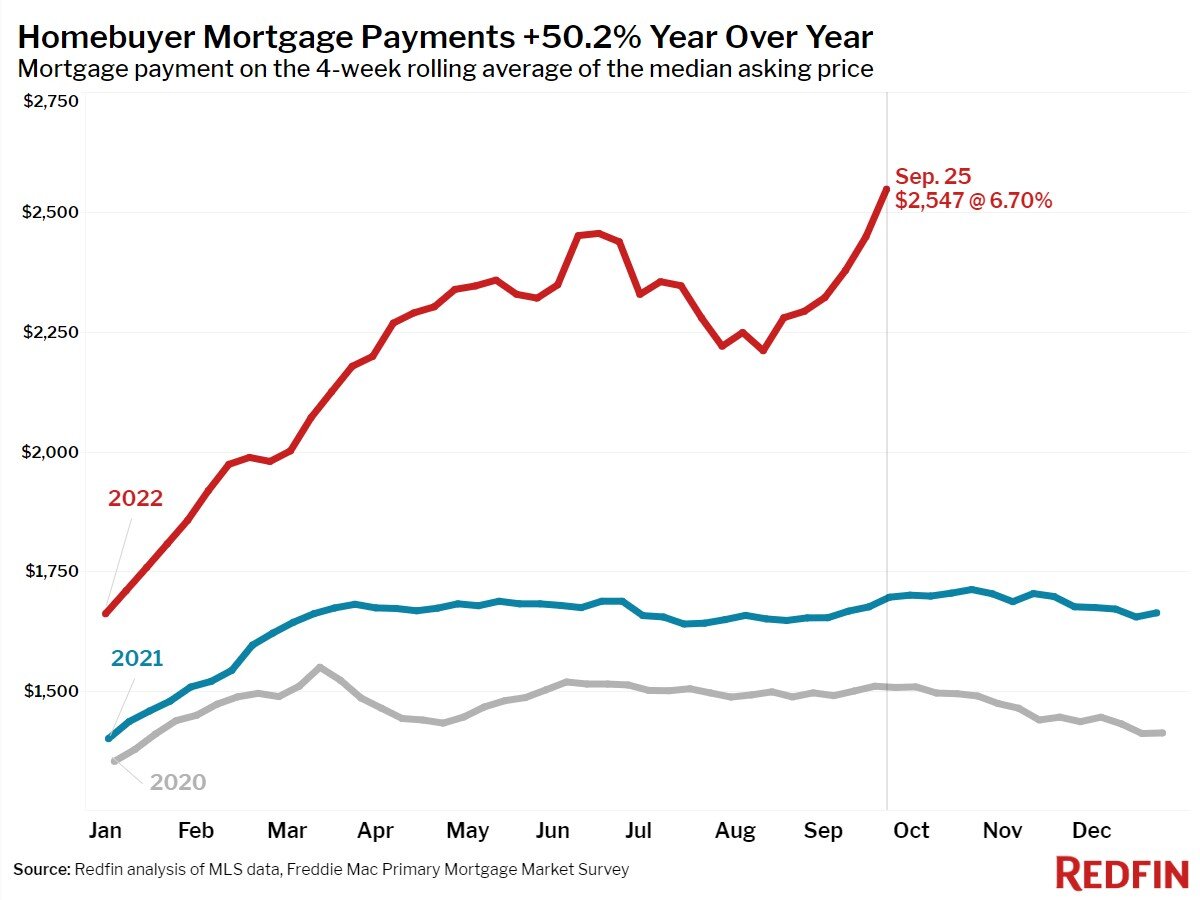
According to national property broker Redfin, a typical U.S. homebuyer's monthly mortgage payment has climbed $337 (15%) over the past six weeks to a new high of $2,547.
The extreme volatility and recent surge in mortgage rates has caused many potential homebuyers to delay or cancel their plans to purchase a home altogether. Pending sales dropped to their lowest level since January, and the share of homes sold above list price fell to its lowest level in over two years.
Homeowners are increasingly reluctant to enter the market as mortgage rates approach 7%. Even though new listings are down to their lowest level since February, months of supply (active listings divided by closed sales--the lower the level, the stronger the seller's market) has been growing quickly, reaching three months for the first time since July 2020. This means that more homes are lingering on the market because they are undesirable and/or overpriced, so it's no surprise that the share of home sellers dropping their price reached its highest level on record, at least since 2015 when Redfin began tracking this data.
"It's imperative for home sellers to react quickly and aggressively as the market turns," said Senior Vice President of Real Estate Operations Jason Aleem. "This means adjusting your pricing immediately if you want to be competitive and attract offers from a smaller pool of qualified homebuyers. If your home isn't the 'belle of the ball' in your neighborhood, you're going to need to cut the price to sell it."
"It's important to remember that much of the housing market data and neighborhood comparables being reported are based on home purchases that were agreed to a month or more ago when mortgage rates were a point and a half lower," said Redfin Deputy Chief Economist Taylor Marr. "Sellers should anticipate that buyers are unwilling or unable to pay a price similar to what their neighbor's home sold for a month ago, and buyers should connect with their lenders to find ways to mitigate the impact of rising rates. This could include paying upfront to lock in a rate, switching to an ARM and tightening your budget so you don't end up with a monthly mortgage payment that's a stretch to afford in the months to come."
Leading indicators of homebuying activity:
- For the week ending September 29, 30-year mortgage rates rose to 6.7%, their highest level since July 2007.
- Fewer people searched for "homes for sale" on Google. Searches during the week ending September 24 were down 33% from a year earlier.
- The seasonally adjusted Redfin Homebuyer Demand Index--a measure of requests for home tours and other home-buying services from Redfin agents--was down 13% year over year and fell below the level at the same time in 2020.
- Touring activity as of September 25 was down 18% from the start of the year, compared to an 8% increase at the same time last year, according to home tour technology company ShowingTime.
- Mortgage purchase applications were down 0.4% week over week, seasonally adjusted, and were down 29% from a year earlier during the week ending September 23.
Key housing market takeaways for 400+ U.S. metro areas:
- The median home sale price was $369,250, up 7% year over year. Prices have climbed 1% since the beginning of the month, after 11 weeks of declines.
- Home sale prices in San Francisco fell 4% year over year. Neighboring Oakland, CA, where prices fell 0.5% and New Orleans (-11%) were the only other metro areas that saw year-over-year median-sale-price declines.
- The median asking price of newly listed homes increased 10% year over year to $384,750.
- The monthly mortgage payment on the median asking price home climbed to a record high of $2,547 at the current 6.7% mortgage rate, up 50% from $1,698 a year earlier, when mortgage rates were 3.01% and up from a recent low of $2,210 during the four-week period ending August 14.
- Pending home sales were down 21% year over year, the largest decline since May 2020.
- New listings of homes for sale were down 14% from a year earlier.
- Active listings (the number of homes listed for sale at any point during the period) fell 0.8% from the prior four-week period. On a year-over-year basis, they rose 6%.
- Months of supply--a measure of the balance between supply and demand, calculated by dividing the number of active listings by closed sales--increased to 3.0 months, the highest level since July 2020.
- 35% of homes that went under contract had an accepted offer within the first two weeks on the market, little changed from the prior four-week period but down from 40% a year earlier.
- 24% of homes that went under contract had an accepted offer within one week of hitting the market, little changed from the prior four-week period but down from 28% a year earlier.
- Homes that sold were on the market for a median of 31 days, up a full week from 24 days a year earlier and the record low of 17 days set in May and early June.
- 32% of homes sold above list price, down from 46% a year earlier and the lowest level since February 2021.
- On average, a record high 7.6% of homes for sale each week had a price drop, up from 3.8% a year earlier.
- The average sale-to-list price ratio, which measures how close homes are selling to their asking prices, fell to 99.2% from 100.8% a year earlier. This was the lowest level since February 2021.