Residential Real Estate News

U.S. Housing Market Stalls as Mortgage Rates Edge Up Again
National property broker Redfin is reporting this week that many U.S. homebuyers are retreating back to the sidelines as mortgage rates ascend toward 7 percent.
Redfin's Homebuyer Demand Index -- a measure of requests for tours and other services from Redfin agents--fell 1% from a week ago, the first decline after a month of increases, and mortgage-purchase applications dropped 6%.
Persistently low inventory is also contributing to the slump in demand, as prospective sellers are also sensitive to rate hikes: 85% of mortgage holders have a rate far below 6% and many are eager to hold onto it. Although the decline in new listings of homes for sale has slowed since December, they were still down 17% from a year earlier during the four weeks ending February 12. Asking prices posted their smallest increase since the start of the pandemic (+1.2% year over year) as those who are selling homes attempt to attract buyers.
The bump in mortgage rates is largely due to this week's inflation report, which was full of mixed signals. Inflation eased ever-so-slightly in January, but the overall price of goods and services is still much higher than a year ago and the pace of economic recovery has slowed.
"The somewhat disappointing inflation numbers put a wet blanket on homebuyers after sub-6% rates lit a fire under them a few weeks ago," said Redfin Economics Research Lead Chen Zhao. "Inflation is cooling too slowly--and the job market and retail sales are too strong--for the Fed to ease up on interest-rate hikes, which means mortgage rates are unlikely to fall much in the next few months. That doesn't erase the progress we've made and it doesn't mean rates will soar past 7%. But it is a reminder that the housing-market recovery will remain touch-and-go until we see inflation and the overall economy improve for a longer duration."
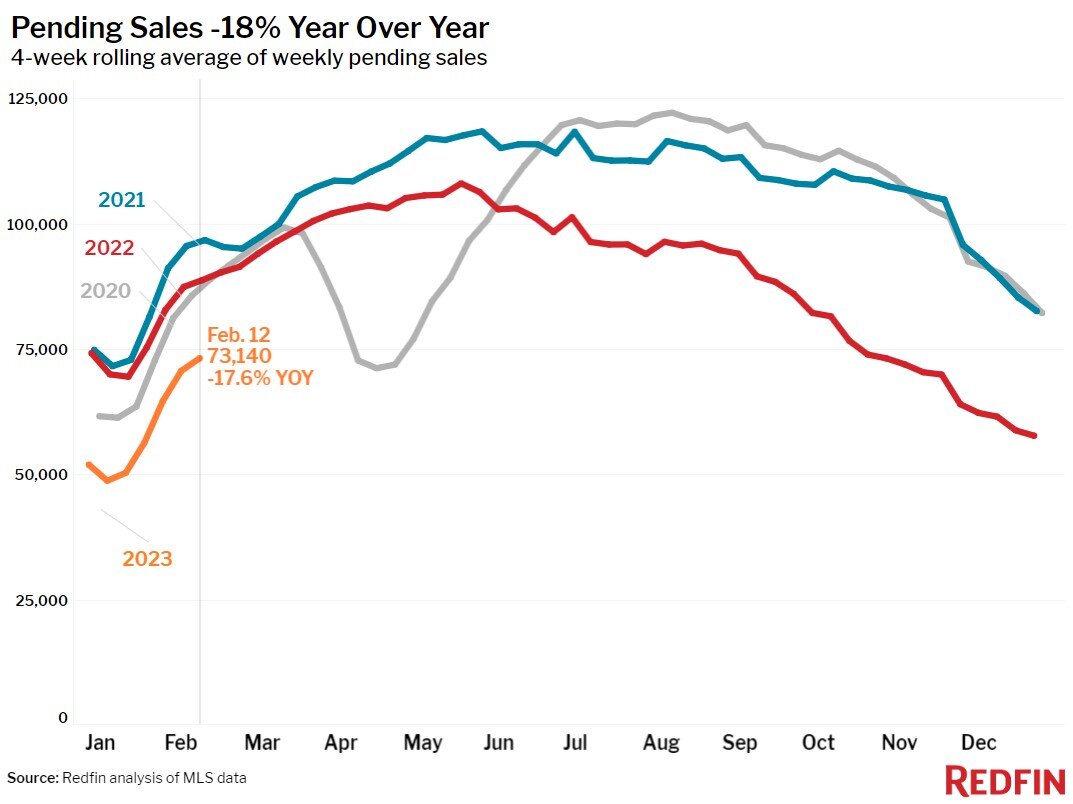
The inconsistent nature of the comeback is evident in this week's data, which shows that although buyers have taken a step back, they're still more active than they were last fall. Redfin's Demand Index is up 17% from the low point it fell to this past fall when mortgage rates peaked at over 7%. Pending home sales also continue to improve; they're down 18% year over year, but that's roughly half of the 33% decline in November. Redfin agents report there's strong demand for move-in ready, well-priced homes in desirable neighborhoods.
"Homes that are priced well are still getting multiple offers, but I did notice buyers making fewer offers this week as interest rates crept back up," said Los Angeles Redfin agent Justin Vold. "Buyers have been hypersensitive to rates since the start of the pandemic. In today's topsy-turvy market, I'm advising people to take a step back from day-to-day rate fluctuations and consider their long term needs. If someone is planning to stay in a home for many years and they can afford today's interest rates, now is a perfectly good time to buy because there's relatively little competition."
"But it may not be the right time for someone who's only looking for a short-term home and/or can barely afford to pay their mortgage with 6% or 7% interest," Vold continued. "Buyers need to be ready to keep the original payment for all 30 years of their loan because although rates will inevitably come down, we don't know when that'll happen. When the opportunity to refinance does come around, shaving off part of the monthly payment will be a bonus."
Leading indicators of homebuying activity:
- For the week ending February 16, average 30-year fixed mortgage rates rose to 6.32%, marking the second straight week of increases. The daily average was 6.75% on February 15.
- Mortgage-purchase applications during the week ending February 10 declined 6% from a week earlier, seasonally adjusted. Purchase applications were down 43% from a year earlier.
- The seasonally adjusted Redfin Homebuyer Demand Index was down 1% from a week earlier and from a month earlier during the week ending February 12, but up 17% from the October 2022 trough. It was down 22% from a year earlier.
- Google searches for "homes for sale" were up about 35% from their November low during the week ending February 11, but down about 24% from a year earlier.
Key housing market takeaways for 400+ U.S. metro areas in February 2023:
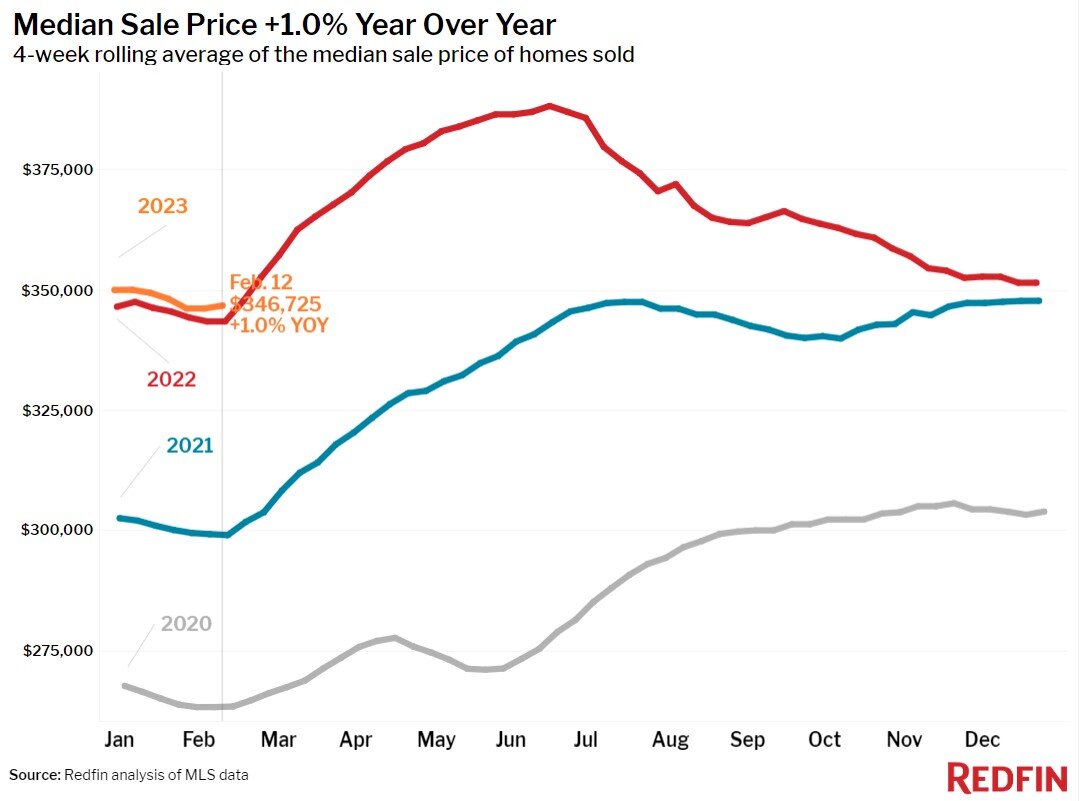
- The median home sale price was $346,725, up 1% year over year.
- Median sale prices fell in 20 of the 50 most populous U.S. metros, with the biggest drops in Oakland, CA (-9.3% YoY), Sacramento (-7.4%), Austin (-7.1%), Phoenix (-5.5%) and Detroit (-5.4%). Prices increased most in Milwaukee (13.6%), West Palm Beach, FL (11.2%), Miami (9.9%), Columbus, OH (9.6%) and Fort Lauderdale, FL (8.9%).
- The median asking price of newly listed homes was $378,118, up 1.2% year over year, the smallest increase since May 2020.
- The monthly mortgage payment on the median-asking-price home was $2,428 at a 6.32% mortgage rate, the current weekly average. That's just $86 (-3%) below the October 2022 peak. Monthly mortgage payments are up 24% ($471) from a year ago.
- Pending home sales were down 17.6% year over year, the smallest decline in over five months.
- Among the 50 most populous U.S. metros, pending sales fell most in Las Vegas (-57.6% YoY), Austin (-51.7%), Phoenix (-48.8%), Nashville (-47.4%) and Riverside, CA (-46.7%). Pending sales rose in two metros: Chicago (67.7%) and Cincinnati (30.2%).
- New listings of homes for sale fell 16.9% year over year. New listings declined in all 50 of the most populous U.S. metros, with the biggest declines in Sacramento (-39.8%), Portland, OR (-38.3%), Oakland, CA (-38.1%), San Diego (-36.9%) and Anaheim, CA (-36%).
- Active listings (the number of homes listed for sale at any point during the period) were up 22.3% from a year earlier.
- Months of supply--a measure of the balance between supply and demand, calculated by the number of months it would take for the current inventory to sell at the current sales pace--was 4.1 months, up from 3.7 months a month earlier and 2.3 months a year earlier.
- 44% of homes that went under contract had an accepted offer within the first two weeks on the market, the highest level since June, but down from 52% a year earlier.
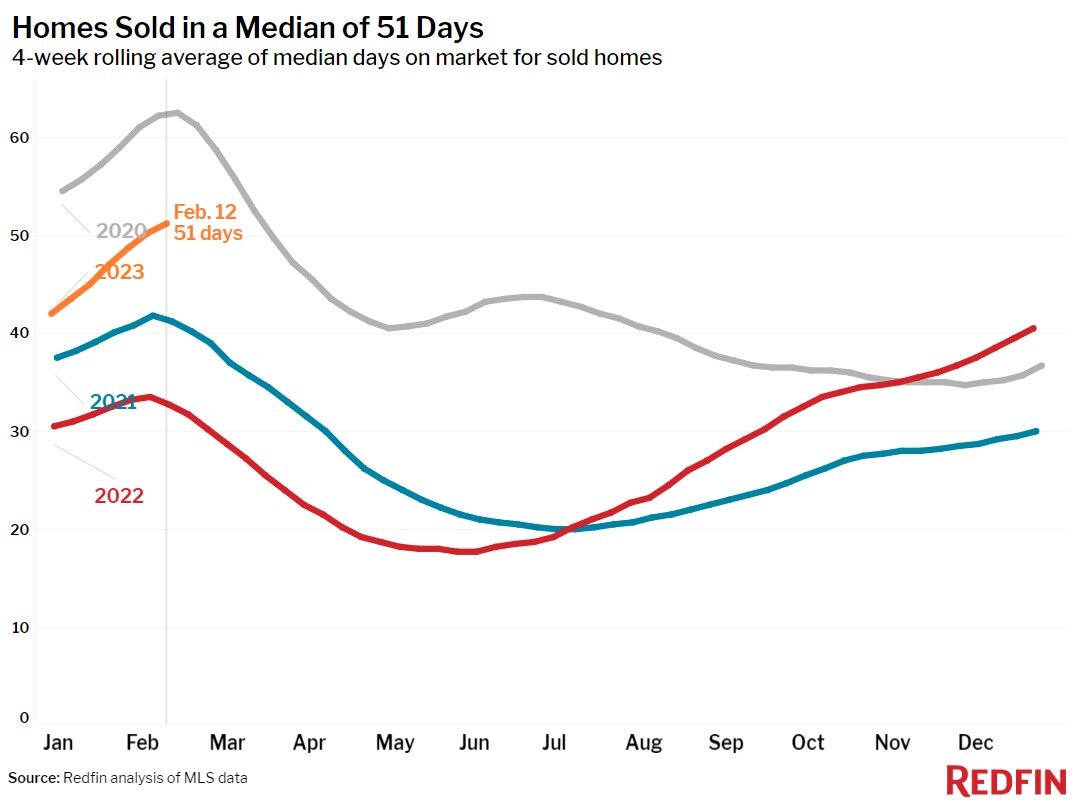
- Homes that sold were on the market for a median of 51 days. That's up from 33 days a year earlier and the record low of 18 days set in May.
- 21% of homes sold above their final list price, down from 40% a year earlier and the lowest level since March 2020.
- On average, 5.1% of homes for sale each week had a price drop, up from 2% a year earlier.
- The average sale-to-list price ratio, which measures how close homes are selling to their final asking prices, fell to 97.7% from 100.1% a year earlier. That's the lowest level since March 2020.