The WPJ
Residential Real Estate News


US Home Prices Record Biggest Jump Since 2006
Home prices in the United States were up 12.1 percent in April, the largest year over year increase since February, 2006, according to data released today by CoreLogic.
Prices were up 3.2 percent from march, the 14th consecutive monthly increase, the firm said.
Early data suggests price increases are continuing. CoreLogic's pending sales index points to a 2.7 percent monthly increase in May, which would move prices to 12.5 percent above prices in May, 2012.
"House price growth continues to surprise to the upside with an impressive 12.1 percent gain year over year in April," said Dr. Mark Fleming, chief economist for CoreLogic. "Increasing demand for new and existing homes, coupled with low inventory, has created a virtuous cycle for price gains, most clearly seen in the Western states with year-over-year gains of 20 percent or more."
The pace of price recovery quickened in April, according to CoreLogic. The data also reflects the trends indicated by recent reports from the National Association of Realtors and the Case Shiller index.
"For the second consecutive month, all 50 states registered year-over-year home price gains excluding sales of distressed homes," Mr. Fleming said. "We expect this trend to continue, bolstered by tight supplies and pent up buyer demand."
More highlights from the April report:
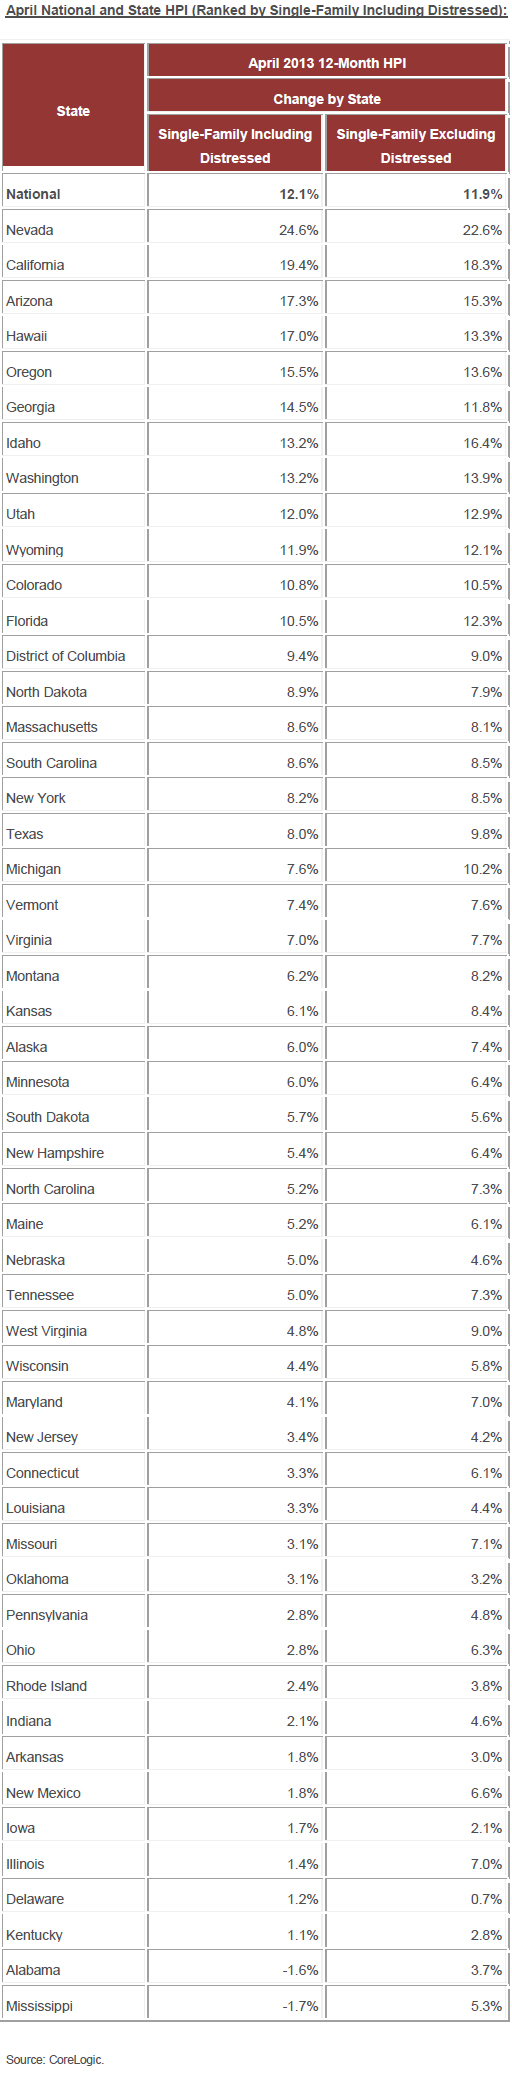
- Including distressed sales, the five states with the highest home price appreciation were: Nevada (+24.6 percent), California (+19.4 percent), Arizona (+17.3 percent), Hawaii (+17 percent) and Oregon (+15.5 percent).
- Including distressed sales, this month only two states posted home price depreciation: Mississippi (-1.7) and Alabama (-1.6 percent).
- Excluding distressed sales, the five states with the highest home price appreciation were: Nevada (+22.6 percent), California (+18.3 percent), Idaho (+16.4 percent), Arizona (+15.3 percent) and Washington (+13.9 percent).
- Excluding distressed sales, no states posted home price depreciation in April.
- Including distressed transactions, the peak-to-current change in the national HPI (from April 2006 to April 2013) was -22.4 percent. Excluding distressed transactions, the peak-to-current change in the HPI for the same period was -16.3 percent.
- The five states with the largest peak-to-current declines, including distressed transactions, were Nevada (-47.3 percent), Florida (-40.5 percent), Michigan (-36.1 percent), Arizona (-36 percent) and Rhode Island (-34.7 percent).
- Of the top 100 Core Based Statistical Areas (CBSAs) measured by population, 94 were showing year-over-year increases in April, the same as in March 2013.
Real Estate Listings Showcase


This website uses cookies to improve user experience. By using our website you consent in accordance with our Cookie Policy. Read More