Residential Real Estate News


U.S. Housing Market Hits a Turning Point, Over Half of Homes Lose Value in 2025
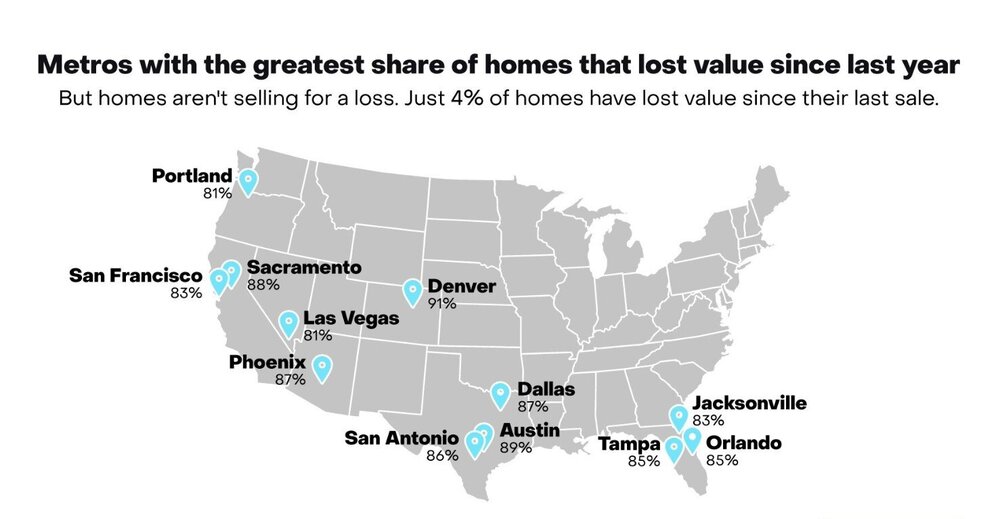
Biggest Share of Home Price Declines Since 2012
The American housing market is entering a new phase of cooling, with a majority of homeowners now seeing their property values slip from last year's highs. New analysis from Zillow shows that 53% of U.S. homes have lost value over the past 12 months -- the largest share since 2012, when the market was clawing its way out of the post-recession trough.
The shift represents a dramatic reversal from 2023, when only 14% of homes were declining in value. But economists say the pullback reflects normalization after years of overheated appreciation, not the start of a broad market downturn.
"Homeowners may feel rattled when they see their Zestimate drop," said Treh Manhertz, a senior economic researcher at Zillow. "But relatively few are selling at a loss. Home values surged over the past six years, and the vast majority of homeowners still have significant equity. What we're seeing now is a normalization, not a crash."
A Cooling Market With Deep Equity Cushions
Despite widespread one-year declines, the typical U.S. homeowner remains far ahead. Since the median last sale -- roughly eight and a half years ago -- home values have climbed 67%. In some supply-constrained markets, gains have been nearly double that pace. Buffalo leads major metros with a staggering 108% increase since last sale, followed by San Jose (97%), Providence (95%), Columbus (90%) and San Diego (88%). Owners in these areas often stay put longer, compounding equity growth.
Still, the current pattern of short-term declines is creating anxiety. For many households, a home is their largest asset, and its value is closely tied to long-term savings and retirement plans. Zillow's data suggests that most homes have slipped from their peak by an average of 9.7%, a modest pullback compared with the 27% drawdown seen at the bottom of the last housing crash in 2012 -- but higher than the unusually small 3.6% dip recorded in the spring of 2022 during the pandemic boom.
Losses at Sale Remain Uncommon
The metric that matters most -- whether a home is worth less than its previous sale price -- remains historically low. Only 4.1% of homes are currently valued below their last sale price, up from 2.4% a year ago but well below the 11.2% rate seen before the pandemic.
The tight inventory environment is playing a major role. While price growth has stalled, a chronic shortage of homes for sale is preventing widespread distress. Just 3.4% of new listings are priced below their last sale price -- a slight uptick from last year but still only about half the pre-pandemic 2019 level of 5.9%.
Regional Divergence Widens
The markets seeing the biggest share of sellers cutting prices tend to be those that overheated most in the pandemic's early years -- as well as the nation's costliest metros.
San Francisco tops the list, with 14% of new listings priced below their last sale, followed by Austin (13%), San Jose (9%), San Antonio (8%) and Dallas (7%). By contrast, markets such as Providence, Milwaukee and Cincinnati are barely seeing any losses at all, with fewer than 1% of new listings priced below their prior purchase price. Thirteen more metros across the Northeast, Great Lakes, South and Midwest are below 2%.
A Market Edging Back Toward Balance
Nationwide home value appreciation has effectively flattened over the past year, but the aggregate masks sharp regional divides. Local market performance now varies not just by metro but by neighborhood -- even block by block. With mortgage rates elevated and affordability stretched thin, economists expect unevenness to persist through 2025.
For now, the story of U.S. housing is less about collapse and more about comedown. After years of breakneck gains, the market is recalibrating -- and while more than half of homeowners may be staring at lower Zestimate values, only a small minority are confronting actual losses.
The correction, in other words, is real -- but so is the cushion.