Residential Real Estate News


Profit Margins on U.S. Home Sales Drop to 2-Year Low
Based on ATTOM's newly released first-quarter 2023 U.S. Home Sales Report, profit margins on median-priced single-family home and condo sales across the United States decreased to 44.2 percent as home prices stayed flat or kept declining around most of the nation.
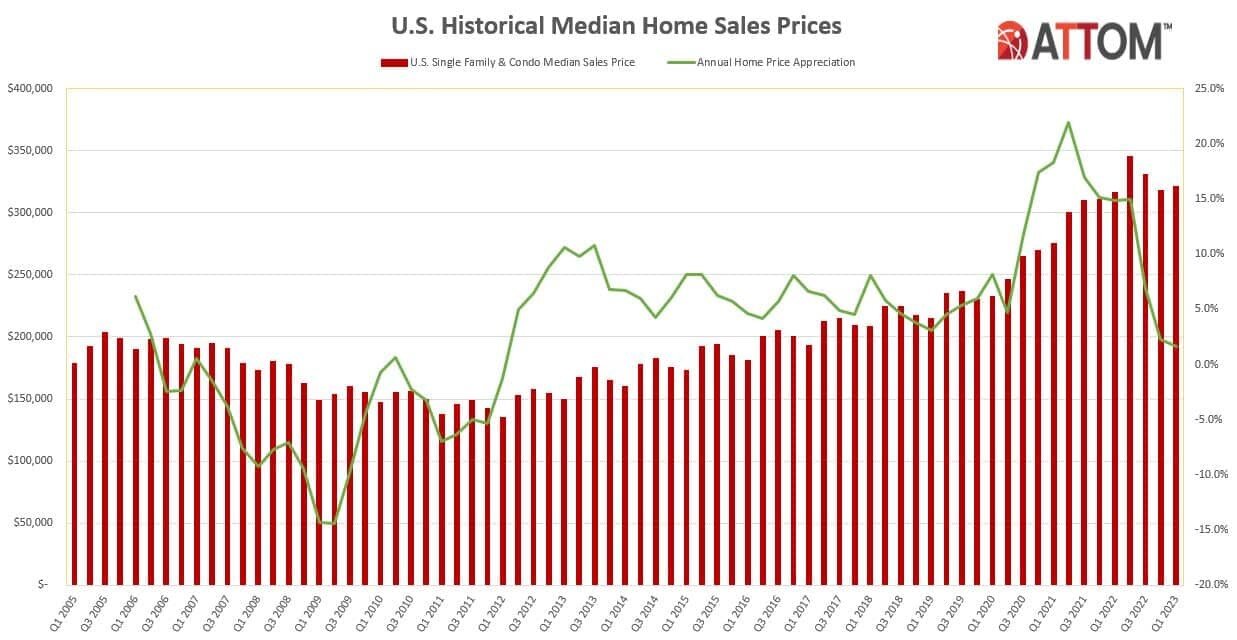
The drop-off in typical profit margins, from 48.7 percent in the fourth quarter of 2022, marked the third straight quarterly decrease nationwide and resulted in the lowest investment return since mid-2021. It came as the national median home price rose just 1 percent quarterly, to $321,135, and values commonly went down in almost three-quarters of major housing markets around the country.
The typical investment return nationwide did remain high in the first quarter - almost double where it stood four years ago. But the margin was off by 12 points from the peak of 56.1 percent hit in the second quarter of last year.
"Homeowners are starting to take a significant hit in the form of lost profits from the recent market slowdown. Nine months of varying price declines around the country have carved away almost a quarter of the profit margin sellers were enjoying in early 2022. That's a striking reversal of what we saw for a decade," said Rob Barber, chief executive officer for ATTOM. "It is possible that the upcoming peak buying season of 2023 could lead to increased profits, owing to favorable mortgage rates and other factors. Over the next few months, we can expect to gain more clarity regarding whether the current market stagnation is a short-term aberration or a more significant trend."
The latest round of faltering profits and prices around the U.S. reflects a housing market that has been stalled since the middle of last year following a decade of almost continuous gains. The nationwide median home price fell 7 percent from the record hit in the second quarter of last year, taking profit margins with it.
That happened as home mortgage rates doubled to more than 6 percent for a 30-year fixed-rate loan, consumer price inflation soared to 40-year highs and the stock market fell back from all-time records. Those forces cut into what prospective home buyers could afford, helping to tamp down demand and lower prices despite short supplies of properties for sale.
As the 2023 home-buying season kicks into gear, the forecast for the market remains murky. Small declines in mortgage and inflation rates over the past few months have come amid predictions among economists of more interest rate hikes and a possible recession.
Profit margins stay the same or decrease in two-thirds of the U.S.
Typical profit margins - the percent difference between median purchase and resale price - stayed the same or went down from the fourth quarter of 2022 to the first quarter of 2023 in 93 (68 percent) of the 137 metropolitan statistical areas around the U.S. with sufficient data to analyze. They were flat or down in 123, or 90 percent, of those metros compared to the second quarter of last year, when returns hit a high point nationwide. Metro areas were included if they had a population greater than 200,000 and at least 1,000 single-family home and condo sales in the first quarter of 2023.
The biggest quarterly decreases in typical profit margins came in the metro areas of Akron, OH (margin down from 66.7 percent in the fourth quarter of 2022 to 47.8 percent in the first quarter of 2023); Stockton, CA (down from 76.7 percent to 59.4 percent); Louisville, KY (down from 48.6 percent to 32 percent); Prescott, AZ (down from 73.3 percent to 58.1 percent) and Buffalo, NY (down from 66.2 percent to 51.5 percent).
Aside from Louisville and Buffalo, the biggest quarterly profit-margin decreases in metro areas with a population of at least 1 million in the first quarter of 2023 were in St. Louis, MO (return down from 33.7 percent to 23.6 percent); San Francisco, CA (down from 58.9 percent to 49.1 percent) and Salt Lake City, UT (down from 53.6 percent to 44.5 percent).
Typical profit margins increased quarterly in just 44 of the 137 metro areas analyzed (32 percent). The biggest quarterly increases were in Trenton, NJ (margin up from 43.6 percent in the fourth quarter of 2022 to 78.6 percent in the first quarter of 2023); Scranton, PA (up from 63.3 percent to 87.5 percent); Lake Havasu City, AZ (up from 63.6 percent to 82.8 percent); Atlantic City, NJ (up from 33.2 percent to 48.5 percent) and Reading, PA (up from 53.9 percent to 68.8 percent).
The largest quarterly increases in profit margins among metro areas with a population of at least 1 million came in Pittsburgh, PA (up from 47.8 percent to 53.1 percent); Memphis, TN (up from 46.3 percent to 51.1 percent); Richmond, VA (up from 52.1 percent to 55.6 percent); Indianapolis, IN (up from 46.7 percent to 50 percent) and Grand Rapids, MI (up from 64.4 percent to 67.1 percent).
Raw profits flat or down in three-quarters of nation
Profits on median-priced home sales, measured in raw dollars, stayed the same or decreased from the fourth quarter of 2022 to the first quarter of 2023 in 100, or 73 percent, of the metro areas analyzed for this report.
The biggest quarterly raw-profit decreases in areas with a population of at least 1 million were in St. Louis, MO (down 30 percent); Louisville, KY (down 29 percent); Birmingham, AL (down 28 percent); New Orleans, LA (down 24 percent) and Buffalo, NY (down 22 percent).
The largest raw profits on median-priced sales in the first quarter of 2023 were in San Jose, CA (profit of $475,000); San Francisco, CA ($316,000); Naples, FL ($255,750); San Diego, CA ($242,750) and Seattle, WA ($236,000).
Prices even or down in three-quarters of metro areas around the U.S.
Median home prices in the first quarter of 2023 decreased or remained the same compared to the prior quarter in 104 (75 percent) of the 139 metro areas around the country with enough data to analyze, although they were still up annually in 102 of those metros (73 percent). Nationally, the median first-quarter price of $321,135 was up 1 percent from $318,000 in the fourth quarter of 2022 and up 1.6 percent from $316,000 in the first quarter of last year.
The biggest decreases in median home prices from the fourth quarter of 2022 to the first quarter of 2023 were in Toledo, OH (down 13.7 percent); Trenton, NJ (down 13.3 percent); Pittsburgh, PA (down 11.1 percent); Detroit, MI (down 9.5 percent) and San Francisco, CA (down 8.8 percent).
Aside from Pittsburgh, Detroit and San Francisco, the largest median-price declines during the first quarter of 2023 in metro areas with a population of at least 1 million were in Buffalo, NY (down 8.7 percent) and Baltimore, MD (down 7.3 percent).
Home prices hit new highs during the first quarter of 2023 in only six of the 139 metro areas in the report.
The largest increases in median prices from the fourth quarter of 2022 to the first quarter of 2023 came in Ogden, UT (up 7.2 percent); Naples, FL (up 6 percent); Savannah, GA (up 5.8 percent); Fort Myers, FL (up 5 percent) and Crestview-Fort Walton Beach, FL (up 4.9 percent).
The biggest quarterly increases in metro areas with a population of at least 1 million during the first quarter of 2023 were in Virginia Beach, VA (up 2.3 percent); San Diego, CA (up 1.6 percent); Miami, FL (up 1.2 percent); Riverside, CA (up 1 percent) and Richmond, VA (up 0.6 percent).
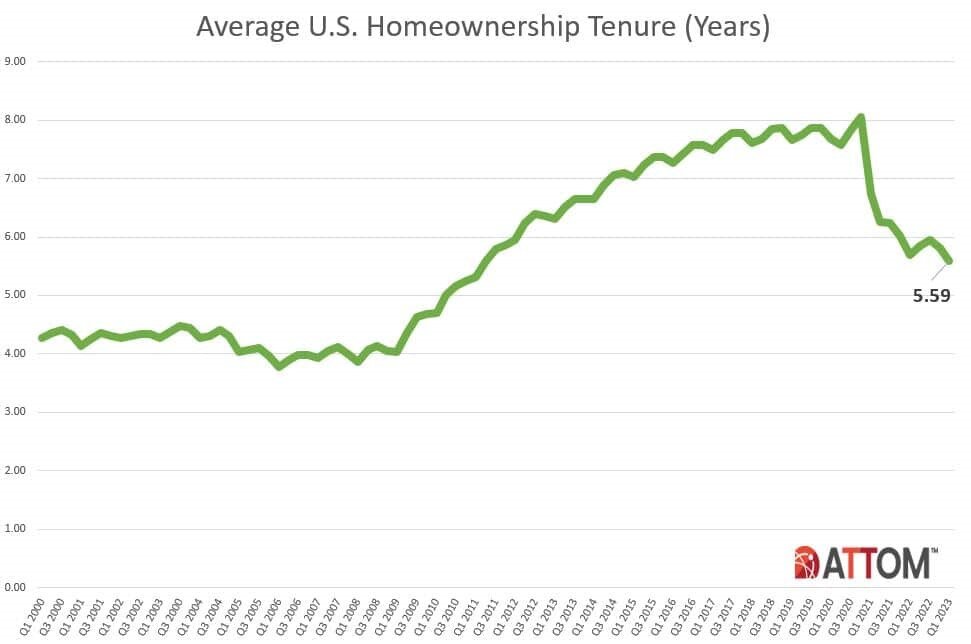
Homeownership tenure hits 12-year low
Homeowners who sold in the first quarter of 2023 had owned their homes an average of 5.59 years. That was down from 5.81 years in the fourth quarter of 2022 and 5.68 years in the first quarter of 2022, to the lowest point since mid-2011.
Average tenure decreased from the first quarter of 2022 to the same period this year in 56 percent of metro areas with sufficient data. They largest declines were in Atlantic City, NJ (tenure down 27 percent); Dayton, OH (down 19 percent); Tallahassee, FL (down 16 percent); Chattanooga, TN (down 15 percent) and St. Louis, MO (down 14 percent).
Fourteen of the 15 longest average tenures among sellers in the first quarter of 2023 were in the Northeast or West regions. They were led by Honolulu, HI (8.21 years); Manchester, NH (8.17 years); Kahului-Wailuku, HI (7.93 years); Bellingham, WA (7.87 years) and New Haven, CT (7.29 years).
The smallest average tenures among first-quarter sellers were in Lakeland, FL (1.22 years); Memphis, TN (2.92 years); Cleveland, OH (3.83 years); Tucson, AZ (3.95 years) and Salem, OR (4.08 years).
Lender-owned foreclosures tick upward, but remain low
Home sales following foreclosures by banks and other lenders represented 1.7 percent, or only one of every 59 U.S. single-family home and condo sales in the first quarter of 2023. That was up from 1.3 percent in the fourth quarter of 2022 and from 1.2 percent in the first quarter of last year. But it remained just a tiny fraction of the 30 percent peak this century hit in 2009 during the aftermath of the Great Recession of 2007.
Among metropolitan statistical areas with sufficient data, those areas where REO sales represented the largest portion of all sales in the first quarter of 2023 included Peoria, IL (13.6 percent, or one in seven sales); Flint, MI (11.9 percent); Lansing, MI (7.3 percent); St. Louis, MO (7.2 percent) and Kalamazoo, MI (6.6 percent).
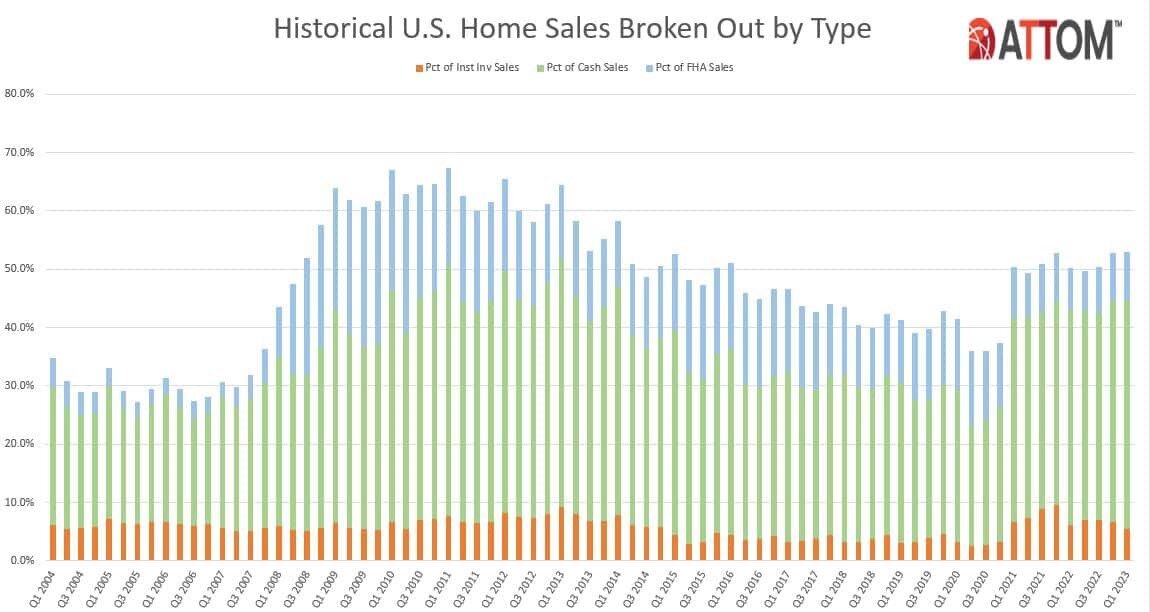
Cash sales hit 10-year high
Nationwide, all-cash purchases accounted for 39.3 percent of single-family home and condo sales in the first quarter of 2023, the highest level since the first quarter of 2013. The latest portion was up from 37.9 percent in the fourth quarter of 2022 and up from 36.9 percent in the first quarter of last year.
Among metropolitan areas with sufficient cash-sales data, those where cash sales represented the largest share all transactions in the first quarter of 2023 included Amsterdam, NY (75.9 percent of all sales); Claremont-Lebanon, NH (69.9 percent); Seneca, SC (69.3 percent); Hudson, NY (68.1 percent) and Palatka, FL (65.2 percent).
Those where cash sales represented the smallest share of all transactions in the first quarter of 2023 included Vallejo, CA (21.4 percent); Seattle, WA (22.5 percent); Spokane, WA (22.6 percent); Washington, DC (22.6 percent) and Kennewick, WA (22.9 percent).
Institutional investment declines
Institutional investors nationwide accounted for 5.4 percent, or one of every 19 single-family home and condo purchases in the first quarter of 2023. That was down from 6.6 percent in the fourth quarter of 2022 and from 6.1 percent in the first quarter of 2022.
Among states with enough data to analyze, those with the largest percentages of sales to institutional investors in the first quarter of 2023 were Georgia (8.4 percent of all sales), Tennessee (7.7 percent), Alabama (7.5 percent), Texas (7.5 percent) and Arizona (7.3 percent).
States with the smallest levels of sales to institutional investors in the first quarter of 2023 included Massachusetts (2.6 percent of all sales), Wisconsin (3 percent), Louisiana (3.2 percent), New York (3.3 percent) and Delaware (3.6 percent).
FHA-financed purchases hold steady
Nationwide, buyers using Federal Housing Administration (FHA) loans comprised 8.3 percent of all single-family home and condo purchases in the first quarter of 2023 (one of every 12). That was unchanged from the fourth quarter of 2022 and up from 7.3 percent a year earlier.
Among metropolitan areas with sufficient FHA-buyer data, those with the highest levels of sales to FHA purchasers in the first quarter of 2023 included Bakersfield, CA (21 percent of all sales); Lakeland, FL (20.1 percent); Dover, DE (19 percent); Pueblo, CO (18.5 percent) and Modesto, CA (18.1 percent).