Residential Real Estate News

U.S. Homes Post First National Price Declines in Over a Decade
CoreLogic's S&P Case-Shiller Index Downticks in April
While monthly home price gains continued to outpace seasonal trends for the second consecutive month, mortgage rate volatility, along with a number of other consumers' concerns this spring (including the debt ceiling, recession risks, layoffs, banking turmoil and a lack of homes for sale) slowed homebuying activity, according to CoreLogic's latest Home Price Index for April 2023.
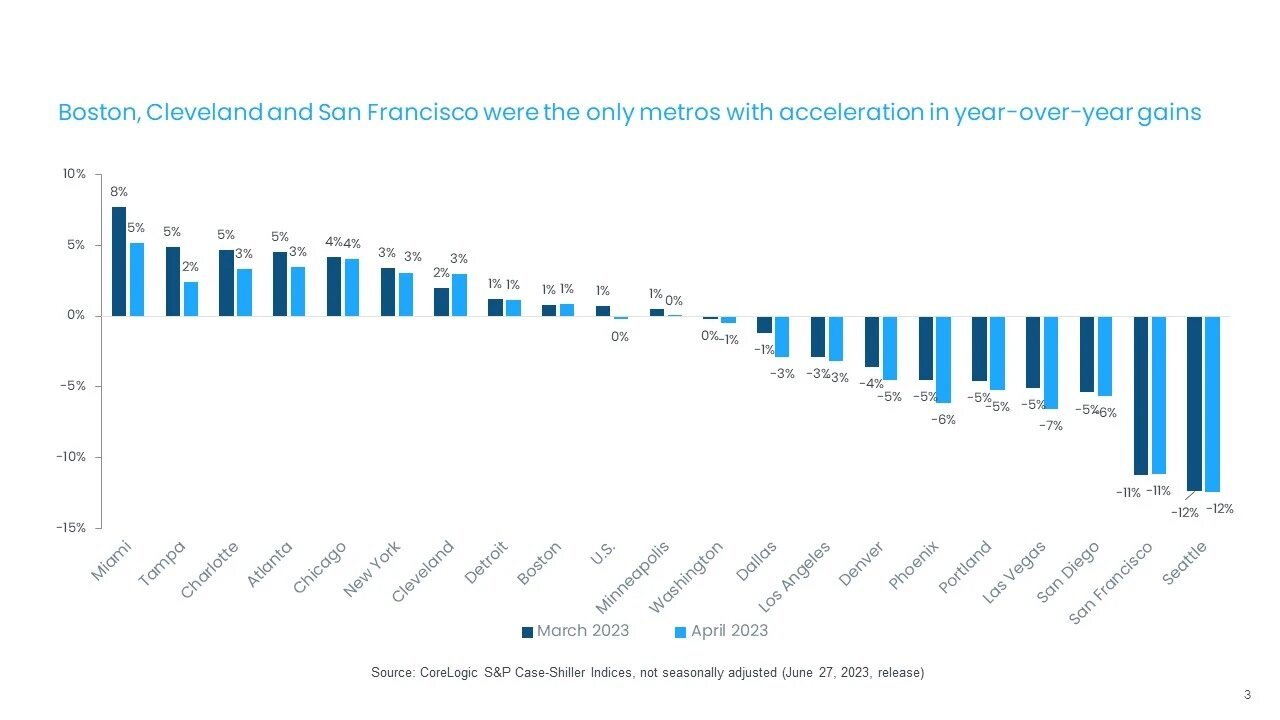
April home sales declined about 10% from the previous month, which contrasts with the typical 10% gain that has historically been recorded between March and April. Nevertheless, housing trends still continue to tell a tale of two markets: one of the West, which is constrained by a lack of existing inventory and less price growth, and the other of the Southeast and South, where the availability of new homes for sale, relative affordability and continued in-migration continue to put pressure on home prices.
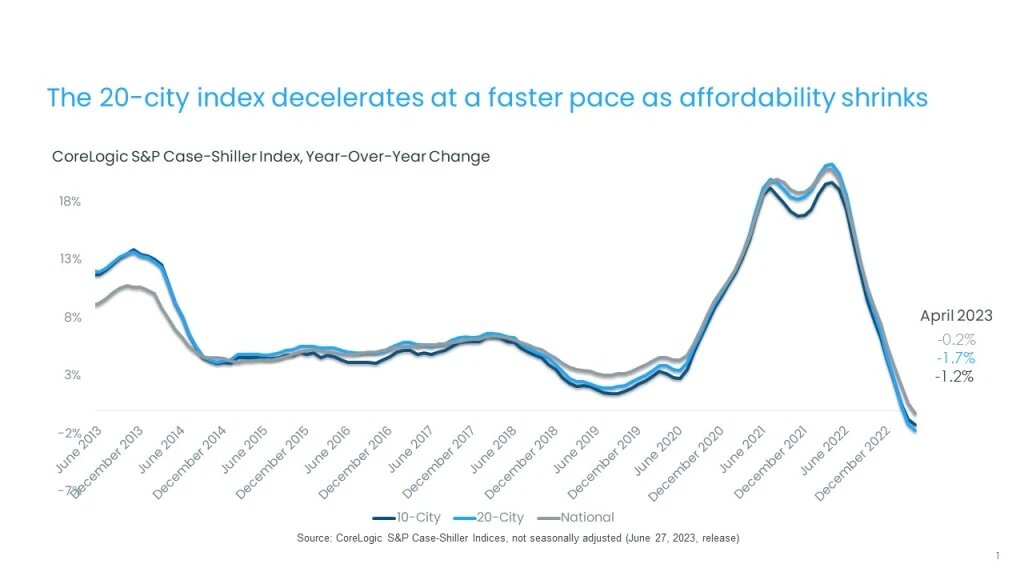
"In April, the CoreLogic S&P Case-Shiller Index fell 0.2%year-over-year for the first time since April of 2012, reflecting price declines that occurred throughout 2022. However, from the month before, home prices showed another strong gain, up another 1.3% which suggests that home buying conditions and home prices are heating up in many markets again. In addition, price gains among high tier homes are once again showing a strong rebound. Also, some markets that were weak during the pandemic are now showing strong price gains across price tiers, particularly Boston," explained CoreLogic Chief Economist Selma Hepp.
"Accumulation of homeowner equity, which averages over $270,000 nationally and over $1 million in some high-cost areas, acts to supports home price appreciation particularly in in-migrating markets where baby bomber homeowners may be retiring to and given that about 50% of baby boomers owning their homes free and clear," continued Hepp.
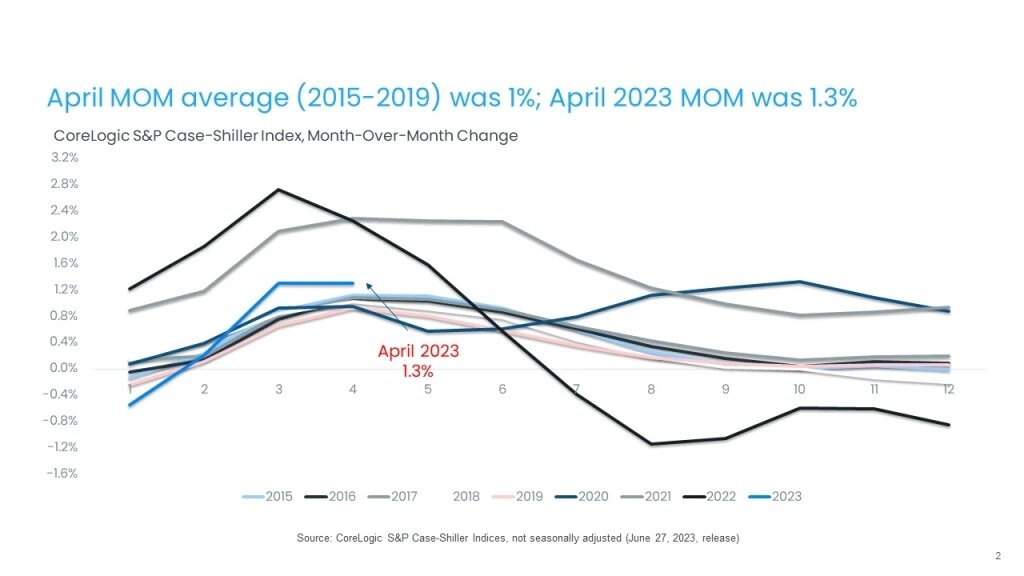
In April, the CoreLogic S&P Case-Shiller Index fell by 0.24% year over year, the first annual loss since April of 2012. However, the annual decline reflects price drops that occurred in 2022. The non-seasonally adjusted month-over-month index, on the other hand, posted its third month of strong gains, up by 1.3% in April, the same increase recorded in March. Between 2015 and 2019, the monthly index changes from March and April have generally averaged 1%. The recent gains in home prices suggest that they have bottomed out and are on the upward trend again.
Home prices in the national index recorded a 5% cumulative decline in February, but with recent monthly gains, prices are now 2% lower than the 2022 peak. Strong price gains this spring also suggest that overall home price appreciation for 2023 is exceeding many initial expectations. The latest CoreLogic Home Price Index projects that home prices nationally will average a 4% increase in 2023 compared with the previous year.
The 10- and 20-city composite indexes annual increase posted declines in April, down by 1.2% and 1.7%, respectively. The 20-city index had relatively larger declines in home prices over the last year, as smaller metro areas are more sensitive to affordability challenges. But again, over the previous month, the 10-city index was up by 1.73%, while the 20-city index increased by 1.68%. The 10-city index includes currently better-performing metros, such as New York and Chicago, which have seen relatively stronger housing market performance since mid-2022, as the return to cities and offices has gotten underway.
Compared with the 2006 peak, the 10-city composite index is now 42% higher, while the 20-city composite is up by 49%. Adjusted for inflation, which continues to remain concerningly elevated, the 10-city index is now down by 2%, while the 20-city index showed a 3% increase compared with its 2006 high point.