Residential Real Estate News

Home Prices Begin to Decline from Record Highs in the U.S.
Inflation, high mortgage rates leading to fewer sales and softening home prices nationwide
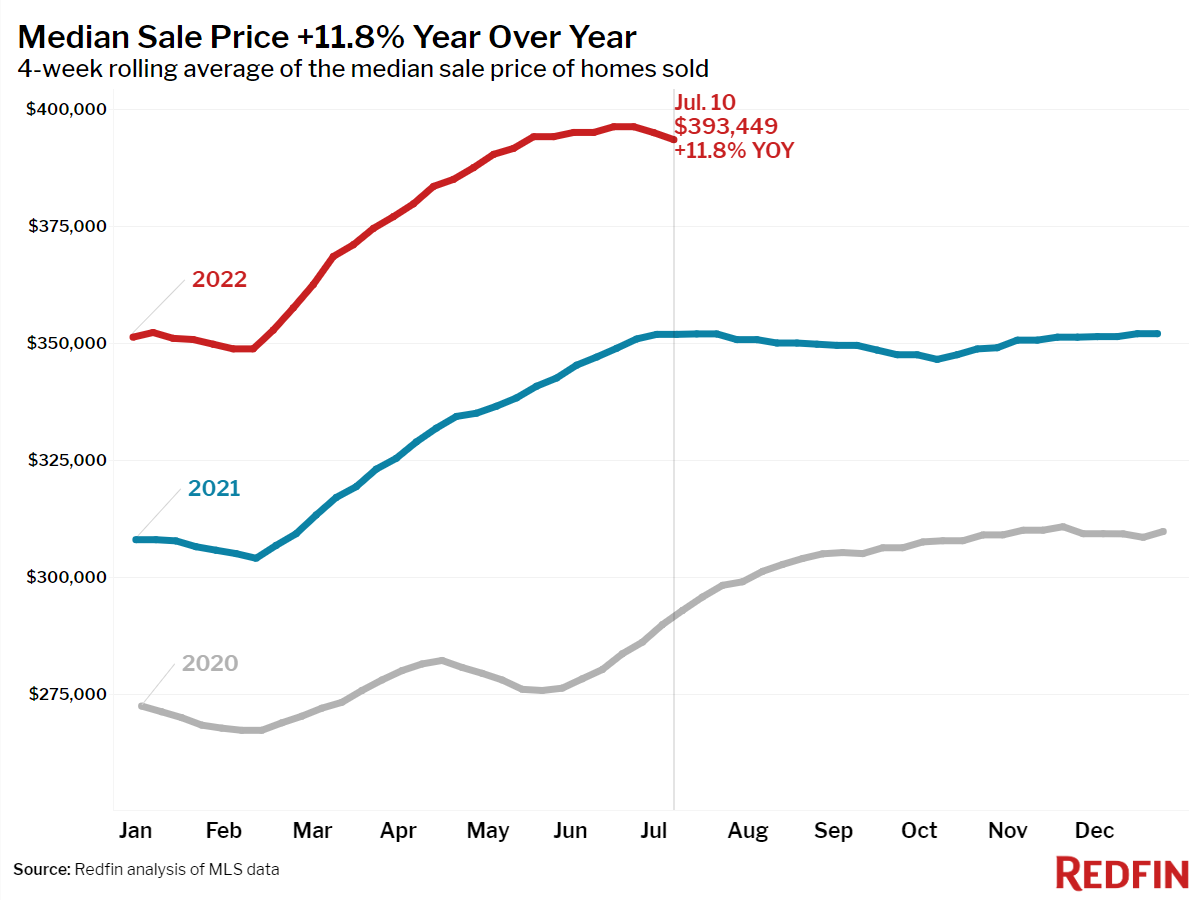
Based on a new report from national property broker Redfin, the median sale price for U.S. homes came down 0.7% from its record-breaking June 2022 peak during the four weeks ending July 10, 2022.
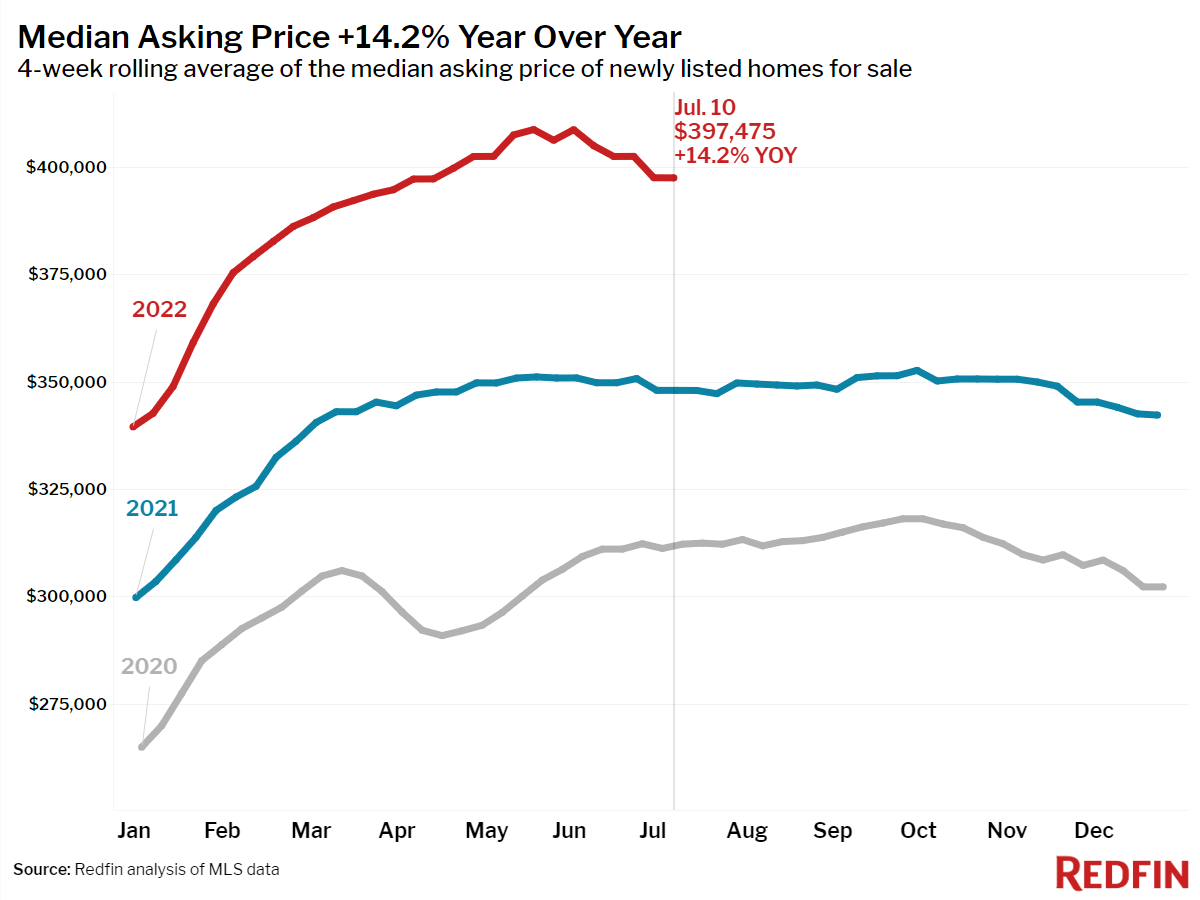
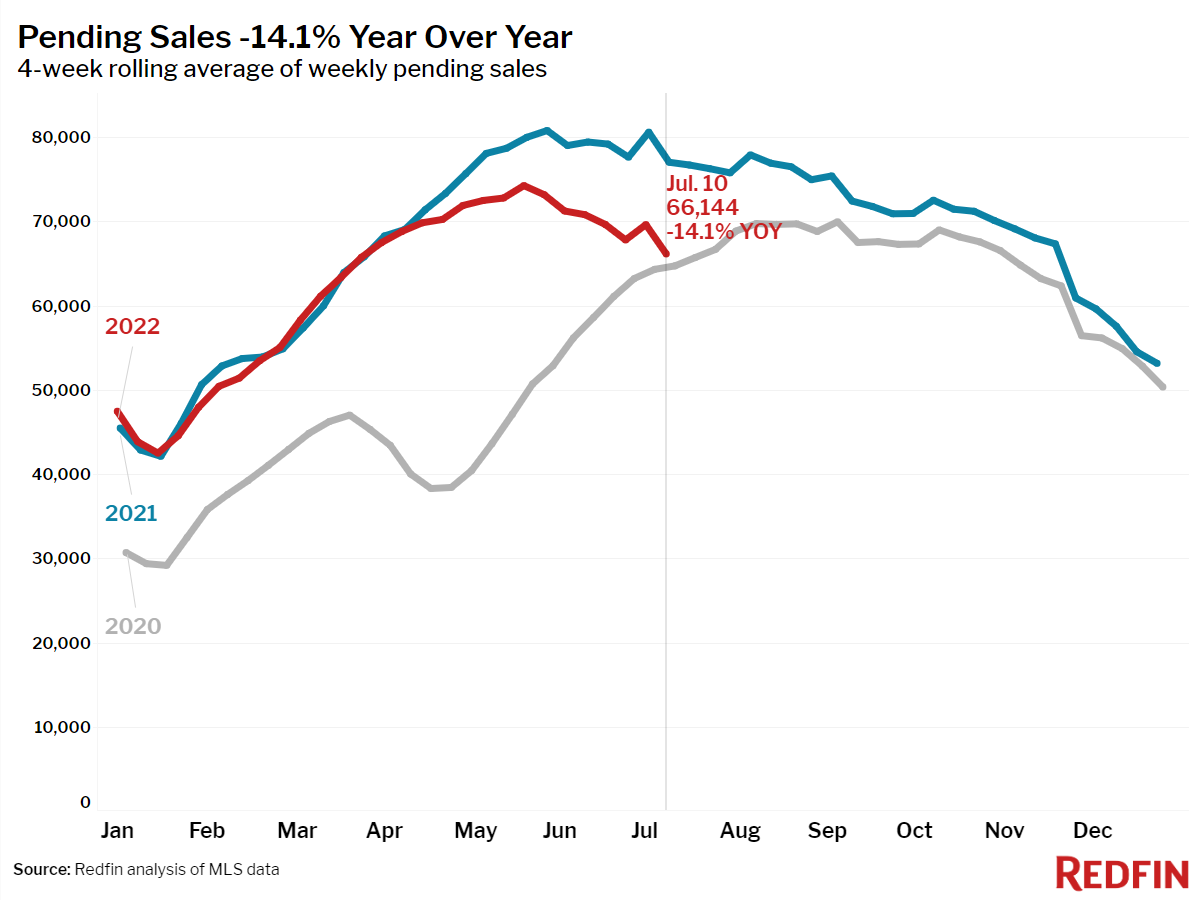
Sellers' asking prices also came down 3% from their May peak as the share of homes with price drops hit another new high. Home supply posted its first year-over-year increase since August 2019 as pending sales continued to slide. These changes in the housing market can be attributed to buyers reaching their limit on costs--not just of homes and mortgages, but also food, transportation and energy.

"Inflation and high mortgage rates are taking a bite out of homebuyer budgets," said Redfin Chief Economist Daryl Fairweather. "Few people are able to afford homes costing 50% more than just two years ago in some areas, so homes are beginning to pile up on the market. As a result, prices are starting to come down from their all-time highs. We expect this environment of reduced competition and declining home prices to continue for at least the next several months."
Leading indicators of homebuying activity:
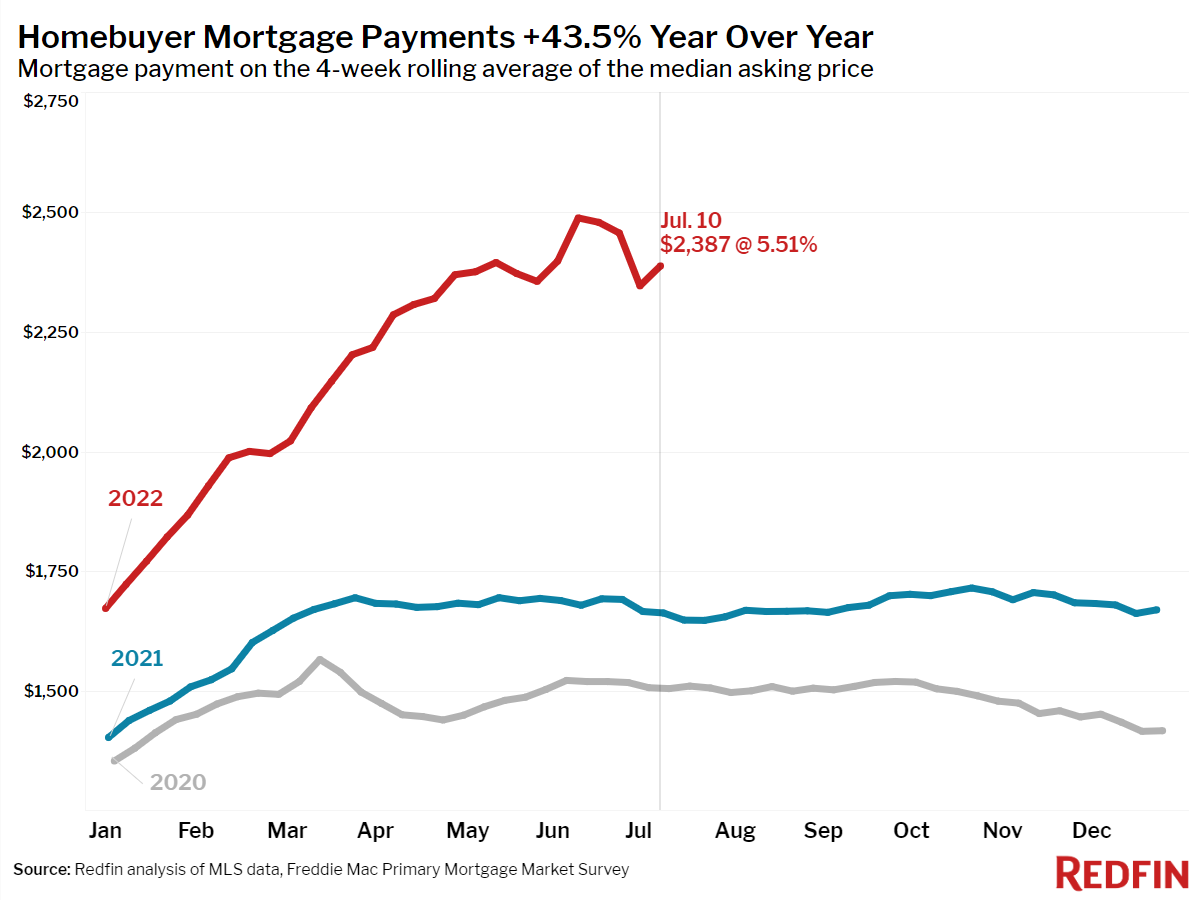
- For the week ending July 14, 30-year mortgage rates rose to 5.51%. This was down from a 2022 high of 5.81% but up from 3.11% at the start of the year.
- Fewer people searched for "homes for sale" on Google--searches during the week ending July 9 were down 5% from a year earlier.
- The seasonally-adjusted Redfin Homebuyer Demand Index--a measure of requests for home tours and other home-buying services from Redfin agents--was down 18% year over year during the week ending July 10.
- Touring activity as of July 10 was up 1% from the start of the year, compared to a 23% increase at the same time last year, according to home tour technology company ShowingTime.
- Mortgage purchase applications were down 18% from a year earlier during the week ending July 8, while the seasonally-adjusted index was down 4% week over week.
Key housing market takeaways for 400+ U.S. metro areas:
- The median home sale price was up 12% year over year to $393,449. This was down 0.7% from the peak during the four-week period ending June 19. A year ago the median price rose 0.9% during the same period. The year-over-year growth rate was down from the March peak of 16%.
- The median asking price of newly listed homes increased 14% year over year to $397,475, but was down 2.8% from the all-time high set during the four-week period ending May 22. Last year during the same period median prices were down just 0.9%.
- The monthly mortgage payment on the median asking price home hit $2,387 at the current 5.51% mortgage rate, up 44% from $1,663 a year earlier, when mortgage rates were 2.88%. That's down slightly from the peak of $2,487 reached during the four weeks ending June 12.
- Pending home sales were down 14% year over year, the largest decline since May 2020.
- New listings of homes for sale were down 1.7% from a year earlier.
- Active listings (the number of homes listed for sale at any point during the period) rose 1.3% year over year--the largest increase since August 2019.
- 43% of homes that went under contract had an accepted offer within the first two weeks on the market, down from 47% a year earlier.
- 29% of homes that went under contract had an accepted offer within one week of hitting the market, down from 33% a year earlier.
- Homes that sold were on the market for a median of 18 days, flat from a year earlier and up slightly from the record low of 15 days set in May and early June.
- 51% of homes sold above list price, down from 54% a year earlier.
- On average, 7.1% of homes for sale each week had a price drop, a record high as far back as the data goes, through the beginning of 2015.
- The average sale-to-list price ratio, which measures how close homes are selling to their asking prices, declined to 101.6%. In other words, the average home sold for 1.6% above its asking price. This was down from 102.2% a year earlier.